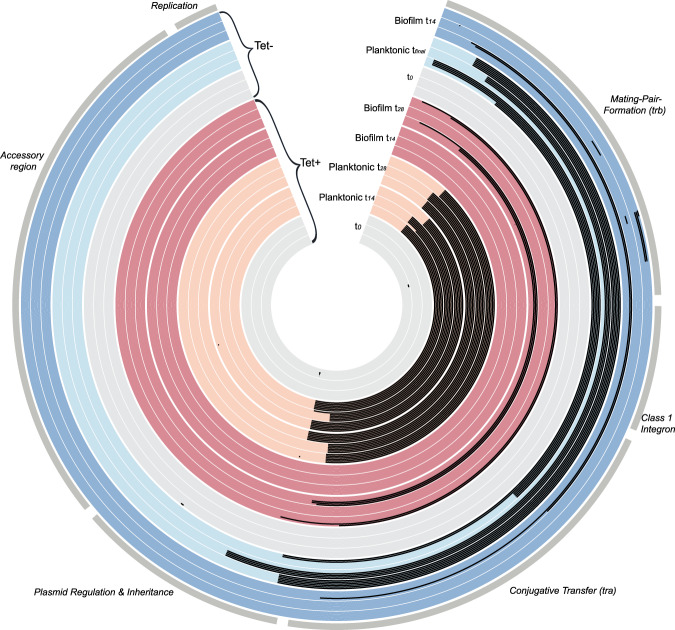
Fig. 3. Maps of evolved plasmids with major segment functions identified, showing all plasmid mutations observed in each sequenced clone evolved under different treatments (Tet+ and Tet−) in different environments (biofilm and planktonic populations).
Evolved clones are grouped by treatment, environment, and time point, as shown by different colors and shades, and identified in the open wedge of the circle. The plasmid genome of each clone is shown as a single band—at each time point, 18 clones were analyzed per treatment and environment (six clones from each triplicate population). Tet+, Tet−: evolved with and without Tet. Black areas in the plasmid maps represent deletions (note that small indels are shown as small spots), and the dots represent SNPs; see Supplementary Table 1 for details. Note that the tetracycline resistance operon is located in the ‘accessory region’.

