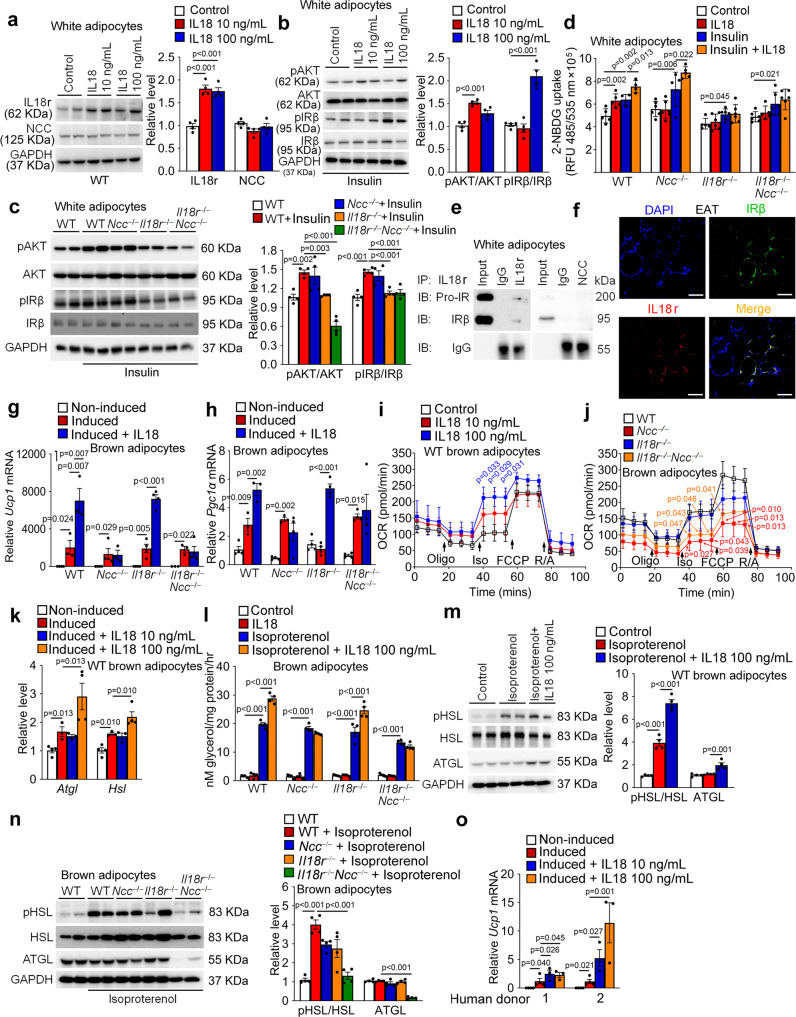
Fig. 5. IL18 mediates thermogenesis through NCC in brown adipocytes and insulin signaling through IL18r in white adipocytes.
a Immunoblots and quantification of IL18r and NCC relative to GAPDH in differentiated WT white adipocytes with or without 10 or 100 ng/mL IL18 for 24 hrs. b-c Immunoblots and quantification of pAKT and pIRβ relative to total AKT or IRβ in differentiated white adipocytes from WT mice (b) or different types of mice (c) treated with or without insulin and IL18 for 30 min. d 2-NBDG uptake in differentiated white adipocytes with or without 20 nM insulin and 100 ng/mL of IL18 for 24 hrs. e Immunoprecipitation of differentiated white adipocytes lysates (250 µg) with anti-IL18r and anti-NCC antibodies, followed by immunoblot detection of IRβ relative to IgG isotype. f Immunofluorescent double staining of IRβ (green) and IL18r (red) in EAT from LFD-fed WT mice. Scale: 25 μm. Representative of 3 independent experiments (e–f). g–h RT-PCR analysis of Ucp1 (g) and Pgc1α (h) in non-differentiated or differentiated brown adipocytes from different mice and treated with or without 100 ng/mL of IL18 for 24 hrs (n = 4/group biologically independent samples). i-j. Kinetic OCR (oxygen consumption rate) of differentiated white adipocytes from WT mice (i) or different types of mice (j) in response to oligomycin, isoproterenol, FCCP, and rotenone with antimycin A. k. RT-PCR analysis of lipolytic genes in non-differentiated or differentiated brown adipocytes treated with or without IL18 for 24 hrs. l-n. Conditional media glycerol level (l), immunoblot and quantification of pHSL and ATGL relative to total HSL or GAPDH in WT brown adipocytes (m), and pHSL and ATGL relative to total HSL or GAPDH in brown adipocytes from different mice (n) treated with or without isoproterenol or IL18 for 3 hrs. o. RT-PCR analysis of Ucp1 levels in human non-differentiated or differentiated brown adipocytes treated with or without IL18 for 24 hrs. n = 4/group biologically independent samples. Data are mean ± SEM, one-way ANOVA test, followed by LSD post-test.

