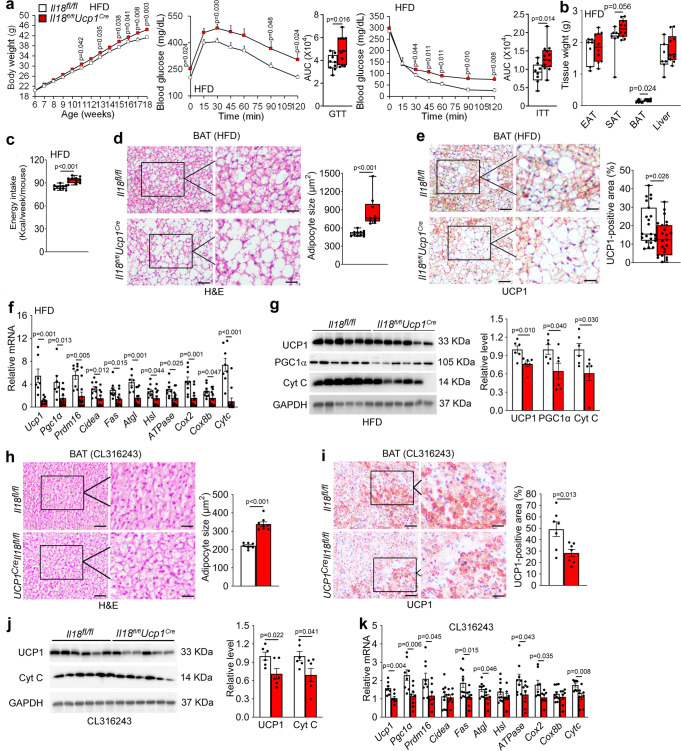
Fig. 6. BAT-selective IL18 depletion in Il18fl/flUcp1Cre mice exacerbates obesity and insulin resistance and impairs BAT thermogenesis.
a–c Bodyweight gain (Il18fl/fl: n = 10; Il18fl/flUcp1Cre: n = 13), GTT and AUC of GTT (Il18fl/fl: n = 9; Il18fl/flUcp1Cre: n = 12), ITT and AUC of ITT (Il18fl/fl: n = 8; Il18fl/flUcp1Cre: n = 13) (a), EAT, SAT, BAT, and liver weights (Il18fl/fl: n = 7; Il18fl/flUcp1Cre: n = 10) (b), and energy intake (Il18fl/fl: n = 10; Il18fl/flUcp1Cre: n = 11) (c) in Il18fl/fl and Il18fl/flUcp1Cre mice fed a HFD for 12 weeks. d–e H&E (Il18fl/fl: n = 11; Il18fl/flUcp1Cre: n = 9) (d) and UCP1 immunostaining (Il18fl/fl: n = 23; Il18fl/flUcp1Cre: n = 23) (e) of BAT from indicated groups of mice. Scale: 50 μm. Inset: 25 μm. f RT-PCR analysis of thermogenic, lipolytic, and mitochondrial genes expression in BAT from indicated mice (Il18fl/fl: n = 8; Il18fl/flUcp1Cre: n = 11). g Immunoblots and quantification of UCP1, PGC1α, and Cyt C relative to GAPDH in BAT from indicated mice (n = 6 per group). h-i. H&E (h) and UCP1 immunostaining (i) of BAT from indicated mice (n = 7 per group). Scale: 50 μm. Inset: 25 μm. j. Immunoblots and quantification of UCP1 and Cyt C relative to GAPDH in BAT from indicated mice (n = 6 per group). k RT-PCR analysis of thermogenic, lipolytic, and mitochondrial genes in BAT from indicated mice (n = 8 per group). Data are mean ± SEM, two-way ANOVA repeated-measures, followed by LSD post-test (a), two-sided Student’s t-test (b-c, e-k), and two-sided Mann-Whitney U test (d). Sample sizes were all biologically independent samples.

