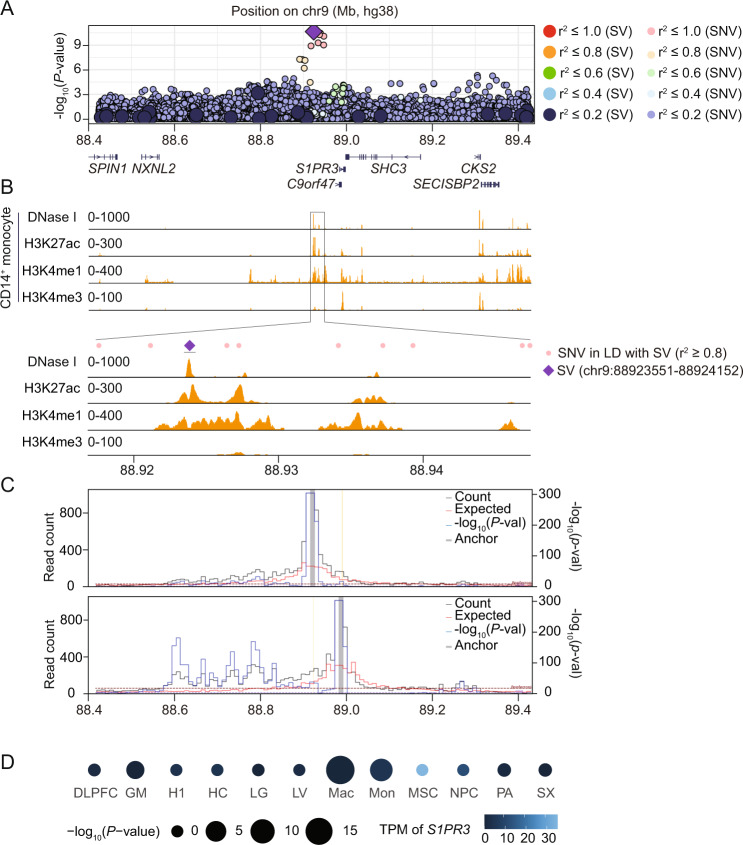
Fig. 1. A structural variant at human 9q22.1 associated with decreased peripheral monocyte count.
All p-values are derived from two-sided t-tests and are not adjusted for multiple comparisons. A Genome-wide association -log10(p-values) for 9q22.1 variants associated with peripheral monocyte counts. The purple diamond represents the trait-associated deletion (9:88923551-88924152); large circles represent other SVs; and small circles represent single nucleotide variants (SNVs) or indels. Color indicates the linkage disequilibrium (LD) calculated in the analysis sample set between the trait-associated deletion and individual SVs and SNVs. B Distribution of accessible chromatin (by DNase I sequencing) and histone modifications (H3K27ac, H3K4me1 and H3K4me3) in primary CD14 + monocytes across indicated genomic regions from ENCODE26. C Virtual 4C plot of long-range chromatin interactions anchored at the trait-associated, 9q22.1 deletion (9:88923551-88924152, upper panel) and the S1PR3 promoter region (9:91605763-91606263, lower panel), shown as a grey bar, in macrophages. Yellow line highlights the S1PR3 promoter region (upper panel) trait-associated, 9q22.1 deletion (lower panel). The observed and expected chromatin contact frequencies (or counts) are represented by the black and red lines, respectively. The left Y axis displays the range of chromatin contact frequency. The statistical significance (–log10(P-value)) of each long-range chromatin interaction is represented by the blue line, with its range listed in the right Y axis. The cell line or tissue specific FDR threshold (5%) is shown as a purple horizontal dashed line, and the more stringent Bonferroni threshold (P = 0.05) is shown as a maroon horizontal dashed line. D Long-range chromatin interaction between the trait-associated, 9q22.1 deletion and S1PR3 promoter calculated in 12 different cell types. MSC (mesendoderm), NPC (neural progenitor cell), HC (hippocampus), H1 (human embryonic stem cells), LV (left ventricle), PA (pancreas), SX (spleen), DLPFC (dorsolateral prefrontal cortex), LG (lung)31, GM (lymphoblast)76, Mac (macrophages), Mon (monocytes)27. The circle size represents the magnitude of the -log10 p-value while the color indicates S1PR3 mRNA level. TPM: transcripts per million.

