
Figure 3.
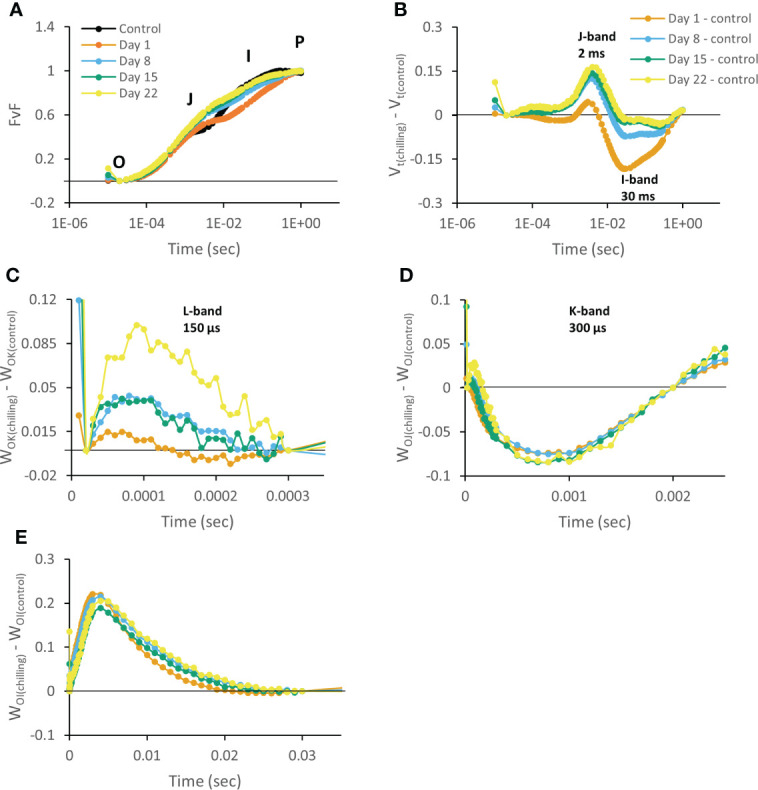
Chlorophyll a fluorescence OJIP transient curves measured at 08.00 h in young fully expanded leaves of Phalaenopsis ‘Edessa’ at 0 (control), 1, 8, 15 and 22 days after exposure to chilling conditions (10°C). Transients were double normalized between O and P steps: Vt (FvF) = (Ft – F0)/(FM – F0) and plotted on a logarithmic time scale (A). Plotted relative variable fluorescence Vt(chilling) – Vt(control) for visualization of J-band (ΔVJ) and I-band amplitudes (ΔVI) on a logarithmic time scale (B). Changes in O-K phase relative variable fluorescence intensity (ΔWOK, L-band) (C), O-J phase relative variable fluorescence intensity (ΔWOJ, K-band) (D) and in O-I phase relative variable fluorescence intensity (ΔWOI) (E). Averaged transients from each time point are illustrated (n = 15 plants). The zero line represents the control group in B, C, D, and E.