
Figure 8.
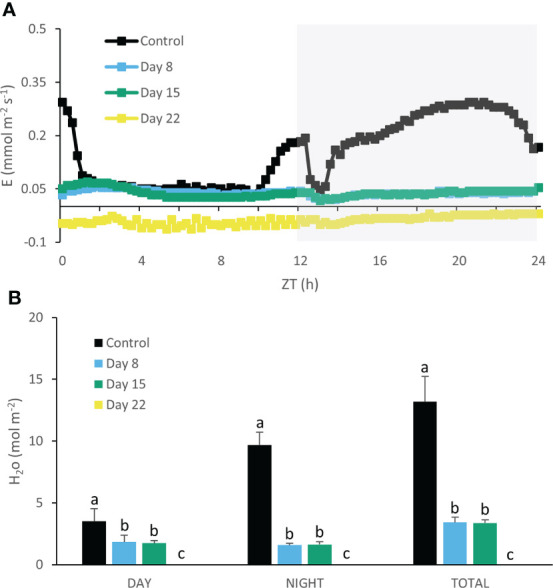
Net 24h transpiration (mmol m-2 s-1) (A) for young fully expanded leaves of Phalaenopsis ‘Edessa’ at 0 (control), 8, 15 and 22 days after exposure to chilling conditions (10°C). The dark period is indicated in gray. Gas exchange curves are representative of three replicate runs with SE < 15%. Net H2O loss (mol m-2) (B) during the day and night as well as total loss over the diel cycle derived by integration. Data are means ± SE (n = 3 plants). Values were compared among the different time points according to Tukey’s HSD test at p < 0.05 marked by different letters.