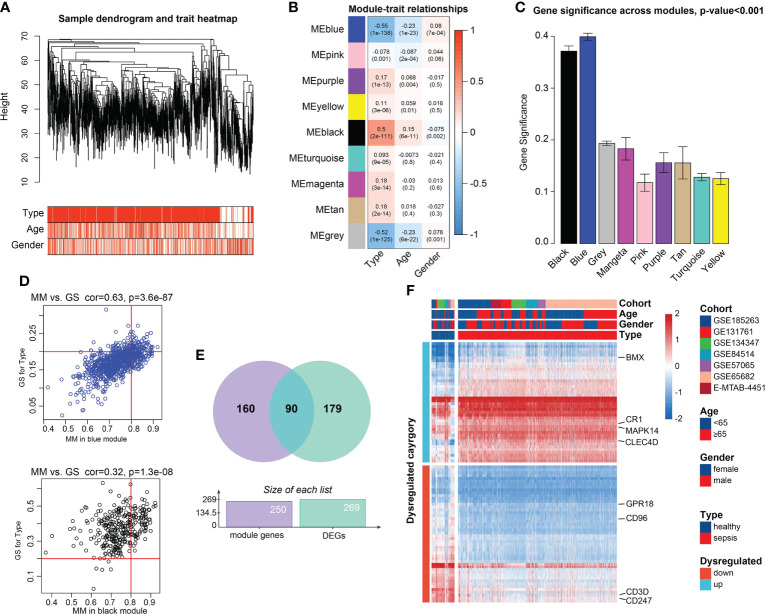
Figure 2.
Candidate genes detection. (A) Clustering dendrogram of the saved 1,778 sepsis samples in WGCNA and clinical features. (B) Heatmap of Pearson correlation analysis of modules and clinical traits. Rows represent modules and columns represent traits. The values in the squares represent correlation degree and p values. Color red represents positive correlation and color blue represents negative correlation. (C) Boxplots of GS among 9 modules. Module blue and module black demonstrated higher values gene significance, than that of the 7 modules, tested by t-test. (D) Scatter plots of Correlation of GS within MM. Genes with |GS |>0.2 and |MM |>0.8 were considered significant. (E) Venn plot of the intersections between DEGs and genes filtered from WGCNA. (F) Heatmap of the candidate genes. The expression values were normalized from -2 to 2. Color red represents relatively increased expression and color blue represents relatively deceased expression.

