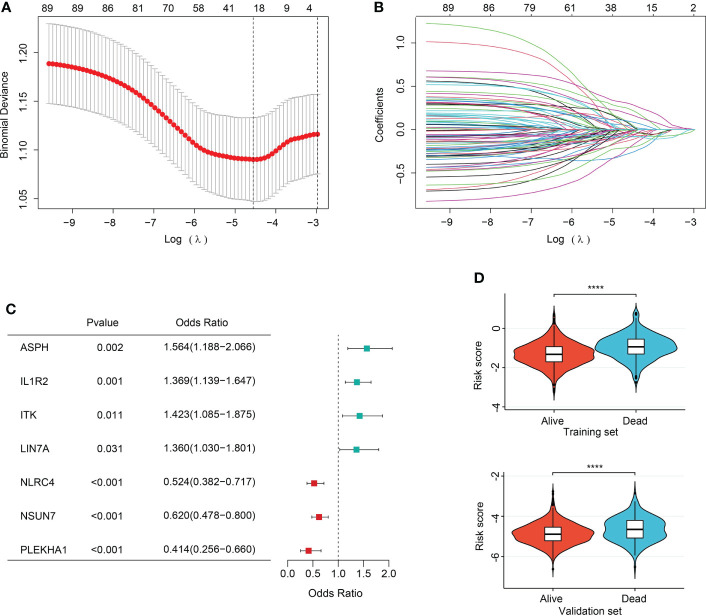
Figure 6.
Feature selection and association of risk score with sepsis outcomes. (A) The ten-fold cross-validation results. The line on the left indicated the value of the parameter log(λ) for the error-minimized model. 28 variables were filtered out when log(λ) = −4.74. (B) LASSO coefficient profiles of the 28 features. (C) Forest plot of features significant in logistic regression analysis. (D) Violin plot of distribution of risk score between cluster A and cluster B in the training (upper) and validation (lower) sets.

