
Figure 3.
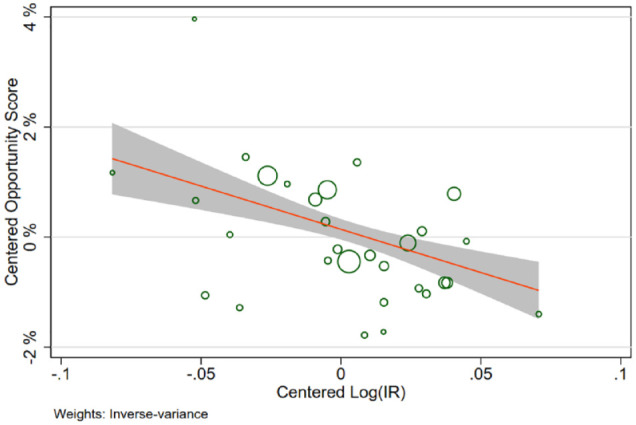
Association of opportunity scores to regional incidence rates (log) for ischemic stroke.
Bubble-plot. Centered opportunity scores and centered logarithmically transformed incidence rates stratified by region and time period are plotted against each other with a regression line obtained from fixed-effects meta regression. The sizes of the circles reflect the number of observations, with larger circles corresponding to greater precision of the estimates and greater weight in the analysis.