Figure 6.
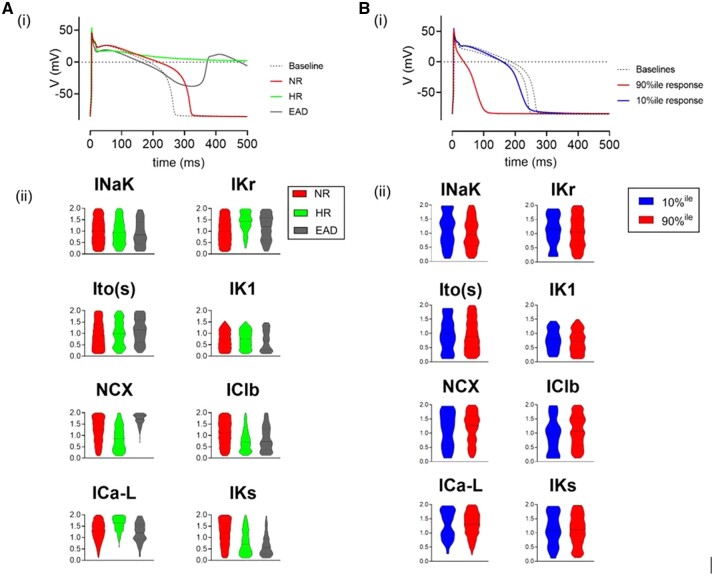
[A(i)], Model APs at baseline (dashed line) and typical responses to 30% IKr reduction. NR (red) shows modest AP prolongation, HR (green) shows failure of repolarization. EAD (grey) responses (defined here as positive deflection of membrane potential ≥10% of AP amplitude) are also shown. [A(ii)] Violin plot comparison of mean ion channel conductance for each AP subgroup. [B(i)] Example traces of two typical AP responses to 60% ICa(L) block. Baselines (dashed lines) and 10%ile (blue) and 90%ile (red) responses are shown. [B(ii)] Violin plot comparison of typical ion channel conductance in low (10%ile) and high (90%ile) responders to ICa(L) block.

