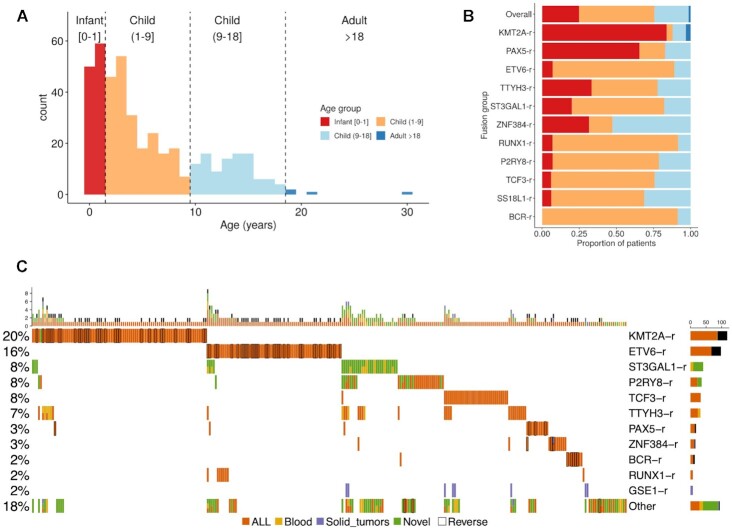
Figure 1.
Multicohort identification of gene fusions in B-ALL. (A) Age distribution of the B-ALL patients studied. (B) The proportion of the gene fusion groups in each age group from (a). (C) Fusion oncoprint. The plot shows the most frequent fusions (rows) detected in patients (columns). Fusions are grouped by the most frequent gene in the fusion gene pairs. The bar plot above shows the number of fusions detected per patient. The specific gene fusion pairs in each patient are given in (Data file 3). A black border line indicates that the reverse fusion was identified in that patient. Cell colors indicate whether the fusions were detected before in B-ALL (orange), in a blood cancer (yellow), in a solid tumor (purple), or whether it was not reported in any cancer before (green). A patient with two different fusions detected in the same gene is depicted with two colors, and they were only kept if they had been previously reported in a tumor and occurred in at least five patients.

