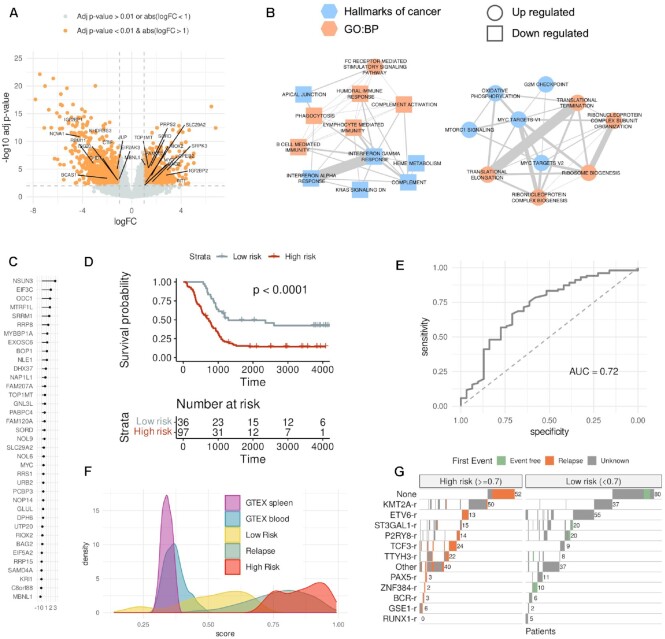
Figure 3.
Gene expression signature of high risk. (A) Differential gene expression between a subset of patients with only KMT2A-r or only ETV6-r. The volcano plot shows for each gene the log2(fold-change) (x-axis) and the -log10(corrected p-value) (y-axis). We indicate the genes involved in RNA processing, RNA translation, and Ribosome biogenesis. (B) Enriched Cancer Hallmarks and Biological Process Gene Ontologies (GO:BP) of the genes significantly up or down-regulated in the comparison in (a). (C) Ranking of the 37 genes of the predictive model of high risk according to their relevance in the leave-one-out test (x-axis). Relevance is defined as the median of the accuracy per gene. (D) Kaplan–Meyer plot of the patients separated as high risk (red) (risk score ≥ 0.7) or low risk (grey) (risk score < 0.7) in a leave-one-out test. (E) Average receiving operating characteristic (ROC) curve and area under the ROC curve (AUC) from the leave-one-out test for classifying patients into low and high risk. The ROC curve shows the specificity (x-axis) and sensitivity (y-axis) for the entire range of possible model score threshold values. Sensitivity is defined as the proportion of high-risk cases that are correctly predicted. In contrast, specificity is defined as the proportion of low-risk cases correctly predicted as low risk. (F) Risk score distribution for various sample groups: diagnostic samples predicted as high risk, diagnostic samples predicted as low risk, samples obtained at relapse, and blood and spleen samples from GTEX. (G) Classification of all the B-ALL diagnostic samples from each fusion subgroup (y-axis) into high (left) or low (right) risk according to our risk score. Patients with a clinical record indicating that they had relapsed are indicated in orange, whereas patients annotated with no relapse are indicated in green (event free). Patients with no clinical information are indicated in grey (unknown).

