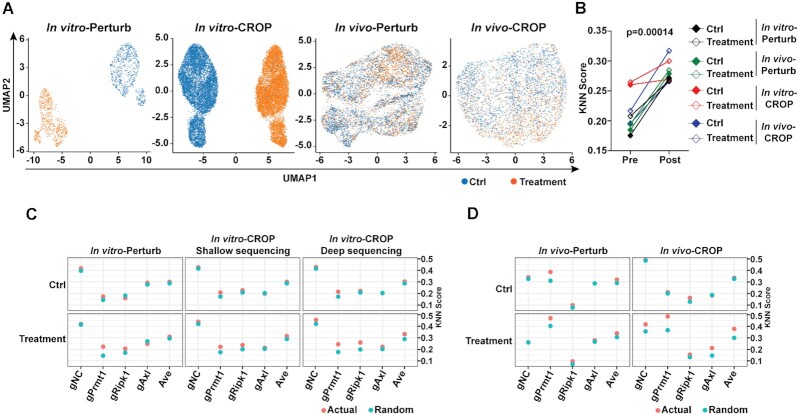
Figure 2.
Performance evaluation and optimization of bioinformatics analysis pipeline of scCRISPR immune screens. (A) Treatment effects of in vitro and in vivo immune screens were revealed by Perturb-seq and CROP-seq. Uniform Manifold Approximation and Projection (UMAP) plots show clusters of cells in the control group (blue dots) and cells in the treatment group (orange dots). (B) Comparison of k-NN scores using raw scCRISPR results and results processed by the optimized bioinformatics analysis pipeline. (C, D) Dot plots showing k-NN scores at different types of gRNA-expressing cells obtained from in vitro 2CT-scCRISPR screens (C) and in vivo ICB-scCRISPR screens (D). Presumptive k-NN scores with random clustering were calculated and labeled with ‘Random’ (blue dots). Actual k-NN scores observed in scCRISPR immune screens were labeled with ‘Actual’ (orange dots).

