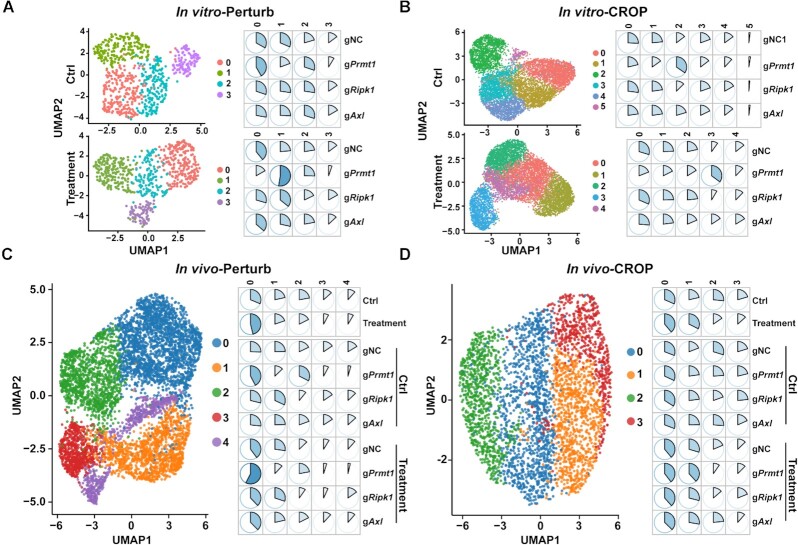
Figure 3.
The scCRISPR immune screens reveal gene-specific effects of perturbing tumor intrinsic immune factors in response to in vitro T-cell killing and in vivo anti-PD-1 treatment. (A, B) The clustering and distribution of gRNA-expressing cells in response to in vitro T-cell treatment by the Perturb-seq platform (A) and the CROP-seq platform (B). For in vitro 2CT-scCRISPR screens, pooled gRNA-expressing MC38/GC cells were treated with tumor-reactive T cells for 16 h. Tumor cells receiving mock treatment were served as controls. (C, D) The clustering and distribution for gRNA-expressing cells in response to in vivo anti-PD-1 treatment by the Perturb-seq platform (C) and the CROP-seq platform (D). For in vivo ICB-scCRISPR screens, pooled gRNA-expressing MC38/GC cells were subcutaneously challenged into C57BL/6 mice. Tumor-bearing mice were treated with either Isotype antibody control group) or anti-PD-1 (treatment group) for 7 days (Perturb-seq) or 14 days (CROP-seq). gRNA transcripts and mRNA transcripts from treated tumor cells were analyzed by indicated scCRISPR platform. UMAP plots (left panels of each figure) and pie charts (right panels of each figure) were used to show cell clusters and percentages of variant clusters in indicated populations, respectively. In the listed pie charts, sum of each row equals 100%.

