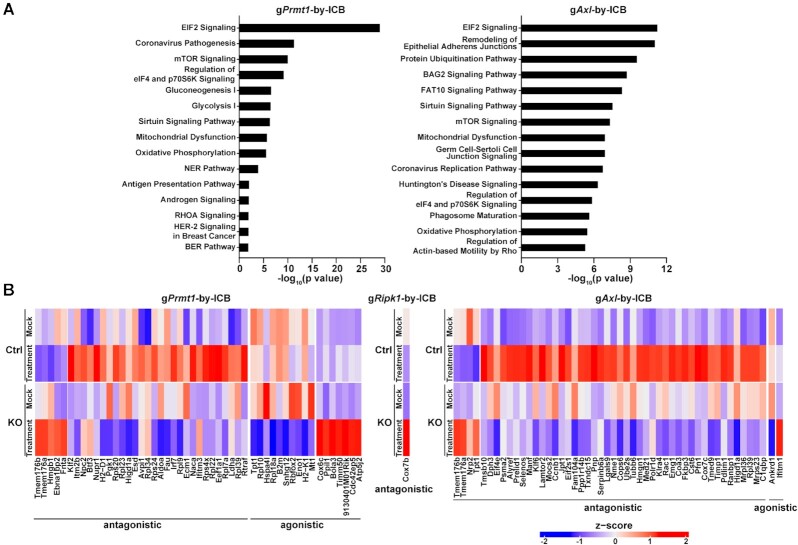
Figure 7.
The interaction effects of gene-specific perturbations and in vivo anti-PD-1 treatment. (A) IPA of genes whose expression levels in tumor cells are modulated by KO-by-PD-1 interaction. Statistical significances of the interaction effects between genetic perturbation and in vivo anti-PD-1 treatment in the in vivo-CROP screen were determined. Genes in which the interaction effect has adjusted P < 0.25 were defined as ‘interaction’ genes and selected for IPA. 251 of 2179 total detected genes and 332 of 1955 total detected genes were identified as genes with interaction effect in gPRMT1 and gAxl cells, respectively. The top 15 canonical pathways displaying statistically significant interaction effects in each genetic perturbation were listed. (B) Heatmaps showing the relative expression levels of top ‘interaction’ genes in Prmt1, Ripk1 and Axl KO tumor cells with or without anti-PD-1 treatment. Up to the top 50 ‘interaction’ genes with the highest fold change of the interaction effect and together with adjusted P-value <0.1 were listed in the heatmap.

