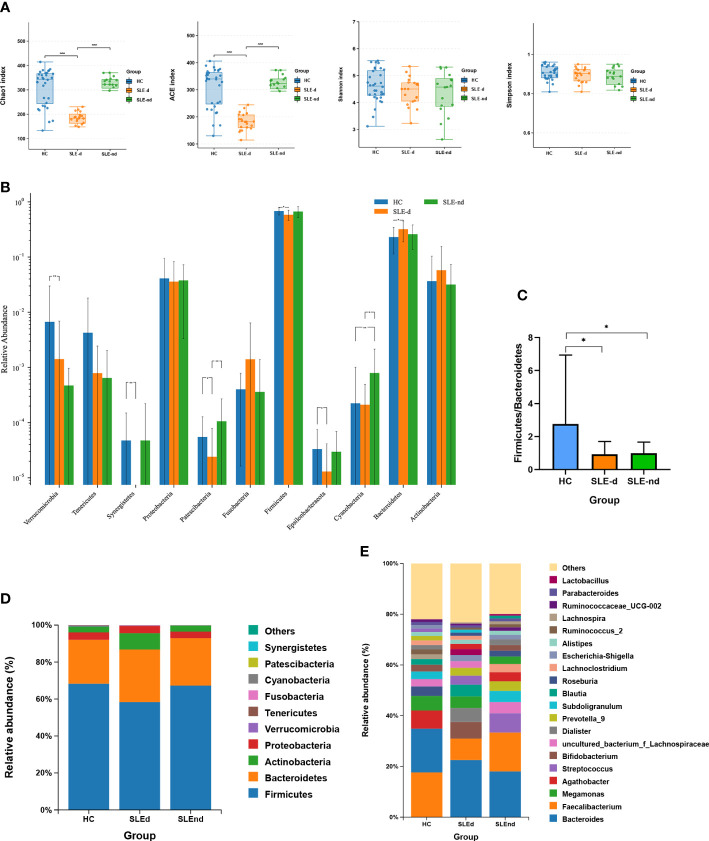
Figure 1.
Microbial structures of the three groups. (A) Ace, Chao, Shannon, and Simpson indexes of the different groups, ***P < 0.001. (B) Significant differences in bacteria in phylum levels among the three groups, *P < 0.05, **P < 0.01. (C) Comparison of the three groups of Firmicutes/Bacteroides phylum ratios, *P < 0.05. (D) Relative abundance of gut microbes at phylum levels in the three groups. (E) Relative abundance of gut microbes at the genus level.

