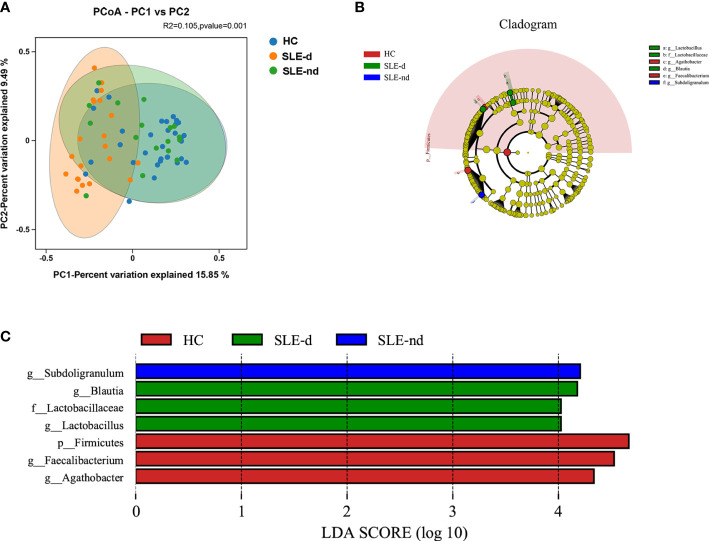
Figure 2.
(A) At the OTU level, the principal coordinates analysis (PCoA) revealed fecal microbiota compositions in the three groups based on the Bray-Curtis distance. R2 = 0.105, P = 0.001. (B) Cladogram from phylum to genus levels of the LEfSe analysis. (C) Histogram of the LDA scores (LDA >4) for different representative genera in HC, the SLE-d group, and the SLE-nd group.

