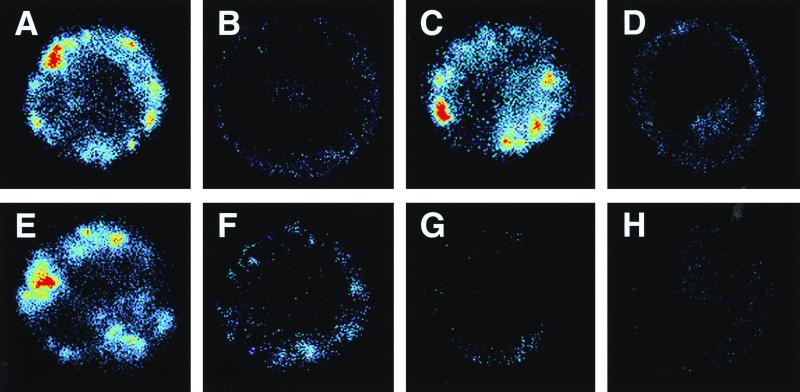
FIG. 7.
Laser scanning confocal microscopic images of representative CHO-CD14 cells exposed to 1 μg of FITC-conjugated E. coli O111:B4 LPS per ml in the presence or absence of various peptides and LPS core-reactive MAb WN1 222-5. LPS was preincubated at 37°C for 15 min, with or without peptide and/or anti-LPS MAb, in the presence of 10% (vol/vol) NHS. The mixture was then added to CHO-CD14 cells, followed by further incubation at 37°C for 30 min. Panels A to H show reaction mixtures containing, in addition to FITC-LPS, 10% NHS, and cells, the following reactants: A, none; B, PMB; C, SAEP-2; D, SAEP-4; E, “nonsense peptide”; F, anti-LPS MAb; G, PMB plus anti-LPS MAb; and H, SAEP-4 plus anti-LPS MAb. Single cells averaging 15 μm in diameter appear in each panel. A representative cell is shown for each specified set of conditions, selected from among at least 50 randomly observed cells. The experiment was repeated twice with similar results. Fluorescence intensity is color coded on a linear scale as follows: red > yellow > green > blue > black (background).

