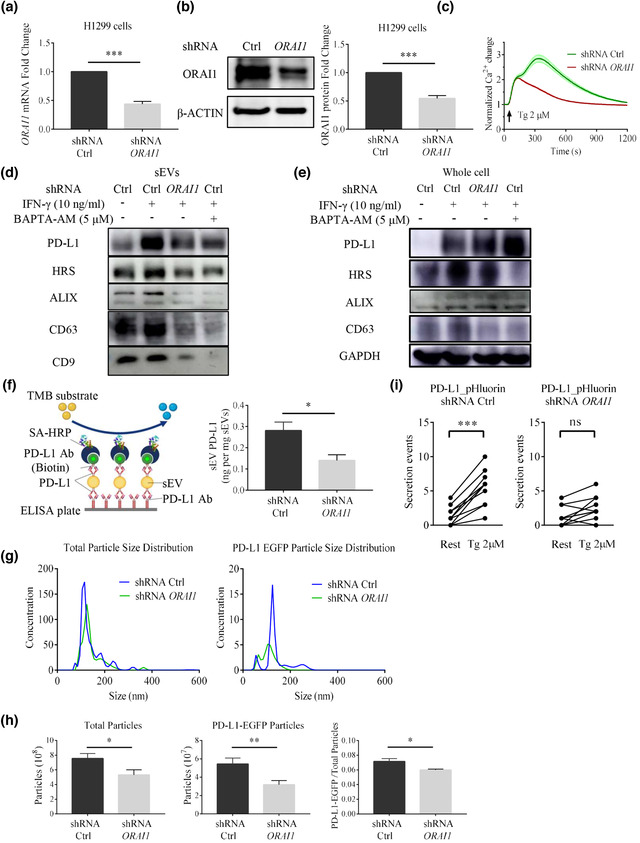
FIGURE 2.

ORAI1 KD reduces sEV PD‐L1 secretion in H1299 cells. (a) The ORAI1 mRNA level is reduced in shRNA knockdown (KD) against the ORAI1 gene in H1299 cells (n = 3). (b) Immunoblotting confirms that ORAI1 protein expression is reduced after knocking down ORAI1 gene in H1299 cells. The right panel shows the quantification of each blot normalized to β‐actin (n = 3). (c) ORAI1‐KD cells show the reduction of Tg‐ (2 μM) mediated Ca2+ responses in H1299 cells. Values of fluorescent intensity represent mean ± SEM, which is normalized to the basic fluorescence intensity. All data is derived from more than 4 wells in 3 individual experiments. Immunoblotting analysis of PD‐L1 and sEV markers in sEVs (d) and whole‐cell lysate (e). IFN‐γ (10 ng/ml) or Bapta‐AM (5 μM) treatment are indicated in control H1299 cells and ORAI1‐KD H1299 cells (n = 3). (f) Schematic diagram of ELISA for the measurement of the concentration of sEV PD‐L1 (left). Comparison of the amounts of PD‐L1 in sEVs derived from control cells and ORAI1‐KD cells by ELISA experiments (right, n = 3). (g) Comparison of total particle size distribution (left) and PD‐L1_EGFP particle size distribution (right) in medium derived from control H1299 cells and ORAI1‐KD H1299 cells by NTA. Both cell types have been transfected with PD‐L1_EGFP plasmids. Units are in millions of particles per milliliter. (h) Comparison of total secreted particles (left), PD‐L1_EGFP particles (middle), and the fraction of PD‐L1 EGFP particles among total secreted particles (right) by NTA (n = 3). (i) Measurement of fusion events in individual H1299 cells (n = 10) transfected with PD‐L1_pHluorin in control cells (left) and ORAI1‐KD cells (right) before and during the Tg (2 μM) stimulation. For all of Figure 2, data are representative of at least three independent experiments. ns, not significant; *P < 0.05; **P < 0.01; ***P < 0.001.
