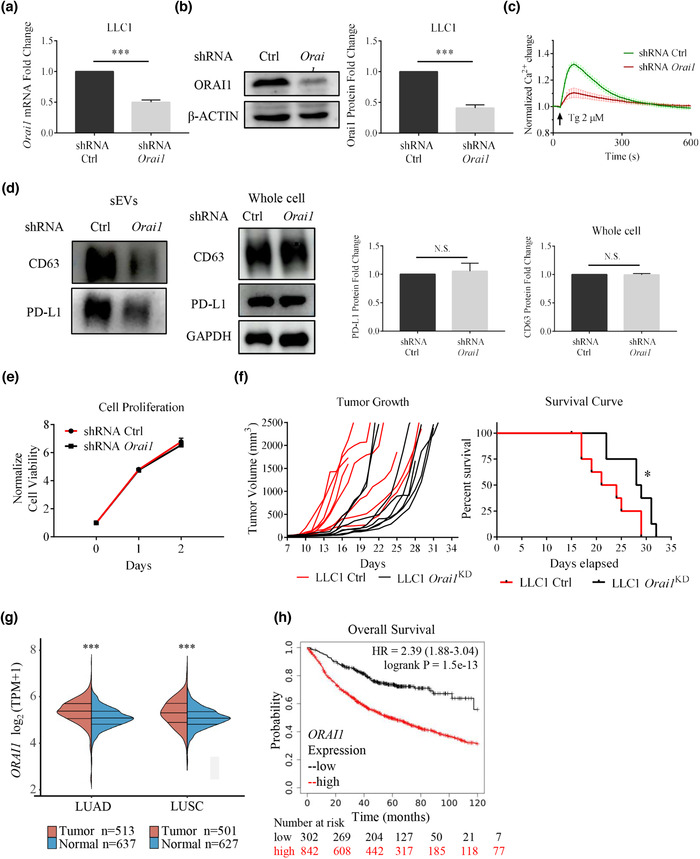
FIGURE 3.

Orai1 KD suppresses tumor progression in the LLC‐1 lung cancer model by reducing sEV PD‐L1 secretion. (a) shRNA efficiently reduced Orai1 mRNA levels in mouse LLC‐1 cells (n = 3). (b) Immunoblotting analysis confirms Orai1 KD; quantification of western blotting data (right, n = 3). (c) Orai1 KD inhibits Tg‐ (2 μM) mediated Ca2+ increases in LLC‐1 cells. Values of fluorescent intensity represent mean ± SEM, which is normalized to the basic fluorescence intensity. All data is derived from more than 4 wells in three‐five individual experiments. (d) Immunoblotting analysis of sEVs (left) and whole cell (right) PD‐L1 protein in control and Orai1‐KD LLC‐1 cells. The normalization analysis is shown on the right (n = 3). (e) Cell counts over time for control and Orai1‐KD LLC‐1 cells. The number is normalized to the initial cell number. (n = 4) (f) Tumor volume graphs from individual animals (left) and mouse survival curves (right) are shown. Tumors are implanted in C57BL/6J mice by subcutaneously injecting 1×10⁶ wild type (control) or Orai1‐KD LLC‐1 cells (n = 8 for each genotype). The significance of the difference between the two groups of samples passed the Log‐rank (Mantel‐Cox) test. (g) The expression of ORAI1 gene in tumor tissues (red) and normal tissues (blue) from TCGA data and GTEx data, where the horizontal axis represents tumor tissues of different NSCLCs, and the vertical axis represents the gene expression distribution. The significance of the difference between the two groups of samples passed the Wilcox test. (h) Kaplan‐Meier survival curves for the ORAI1 gene in NSCLC patients. Overall survival (OS) of patients is plotted both for the low (black) and high (red) ORAI1 expression groups. The ‘number‐at‐risk’ is indicated below the plot. For all of Figure 3, data are representative of at least three independent experiments. ns, not significant; *P < 0.05; **P < 0.01; ***P < 0.001.
