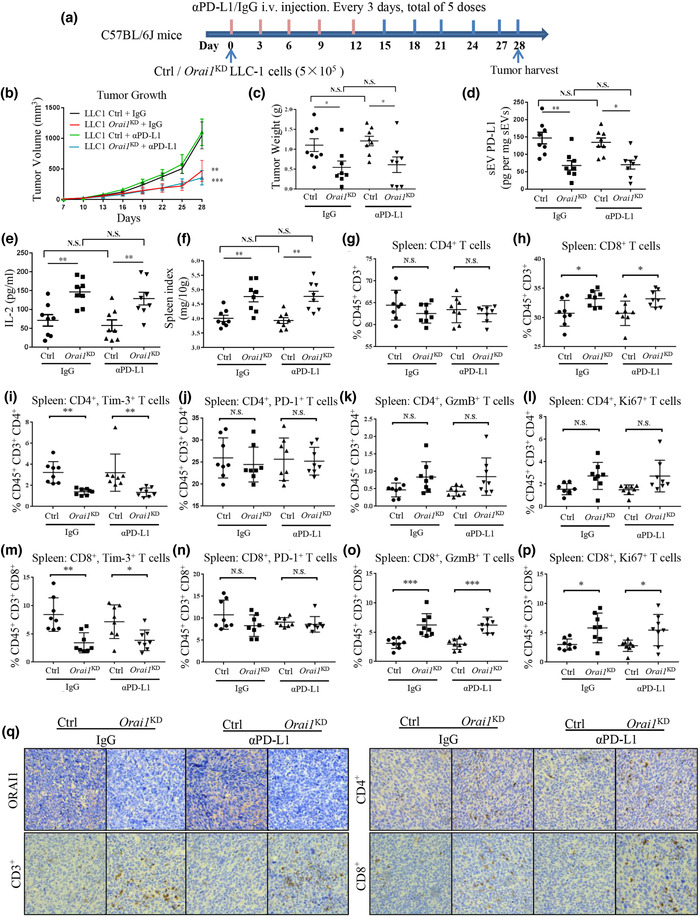
FIGURE 4.

Orai1 KD suppresses tumor progression by enhancing antitumor immunity. (a) Schematic experimental design for animal model experiments. (b) Comparison of tumor growth (volume) over time in mouse lung cancer models. Each C57BL/6J mouse was injected subcutaneously with 5 × 10⁵ Ctrl or Orai1‐KD LLC‐1 cells and treated as indicated (n = 8). (c) Comparison of tumor weights in mouse lung cancer models. (d) Comparison of PD‐L1 protein levels in serum sEVs derived from mouse lung cancer models by ELISA measurement. (e) ELISA quantification of serum IL‐2 expression in mouse lung cancer models. (f) Comparison of spleen index of mouse lung cancer models. (g & h) Flow cytometric quantification of the percentage of CD4+ (g) and CD8+. (h), respectively, among CD45+, CD3+ cells in the spleen. (i & m) Quantification of Tim3+ cells among CD4+ (i) and CD8+ (m) T cells. (j & n) Quantification of PD‐1+ cells among CD4+ (j) and CD8+ (n) T cells. (k & o) Quantification of granzyme B (GzmB) CD4+ (k) and CD8+ (o) T cells. (l & p) Quantification of Ki67 CD4+ (l) and CD8+ (p) T cells. (q) ORAI1, CD3, CD4+ and CD8+ immunohistochemistry (IHC) staining in mice tumor tissues (original magnification 40×). For all of Figure 4, data are representative of 8 experimental animals per group. ns, not significant; *P < 0.05; **P < 0.01;*** P < 0.001. See also Figure S5.
