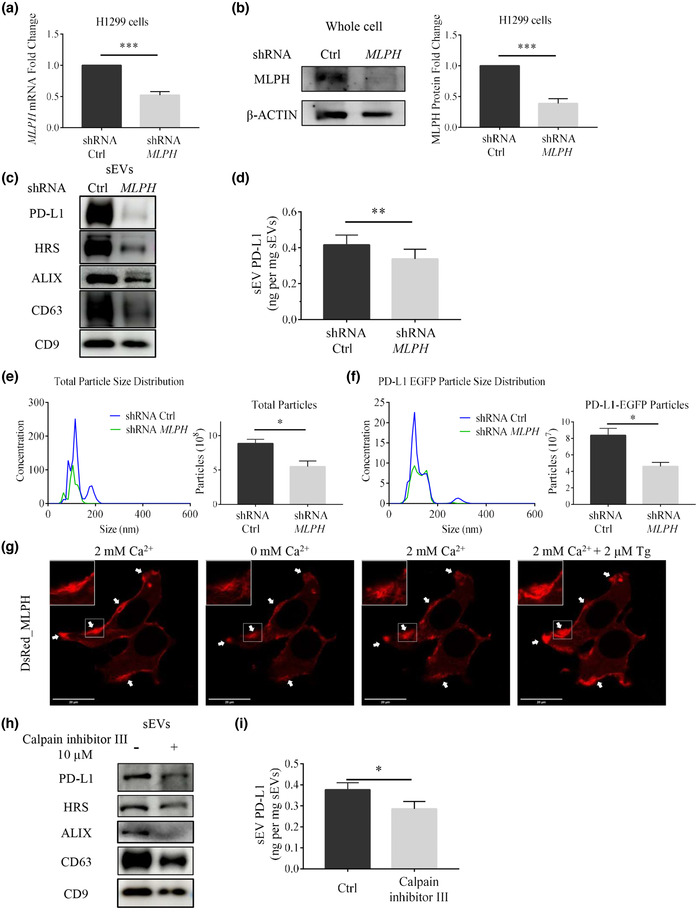
FIGURE 5.

MLPH KD reduces sEV PD‐L1 secretion in H1299 cells. (a) shRNA efficiently reduces MLPH mRNA levels in H1299 cells (n = 3). (b) Immunoblotting analysis confirms MLPH KD (left) and its immunoblotting quantification (right, n = 3). (c) Immunoblotting Comparison of sEVs protein in H1299 cells with or without MLPH‐KD treatment. (d) ELISA measurements of PD‐L1 abundance in sEVs derived from H1299 cells with or without MLPH‐KD treatment (n = 3). (e) NTA comparison of total particle size distribution in H1299 cells with or without MLPH‐KD treatment (n = 3). Units are in millions of particles per milliliter. (f) NTA comparison of PD‐L1 EGFP particle size distribution in H1299 cells transfected with PD‐L1_EGFP with or without MLPH‐KD treatment (n = 3). Units are in millions of particles per milliliter. (g) Distribution of DsRed_MLPH in H1299 cells when cells are exposed to 0 mM Ca2+, 2 mM Ca2+ and 2 mM Ca2+ plus 2 μM Tg treatment. White arrows in the panels point to puncta formed by the MLPH aggregates. (h) Immunoblotting analysis of sEVs protein in H1299 cells in the absence or presence of Calpain inhibitor III (10 μM). (i) Comparison between amounts of PD‐L1 in sEVs derived from H1299 cells with or without Calpain inhibitor III (10 μM) by ELISA (n = 3). For all of Figure 5, data are representative of at least three independent experiments. ns, not significant; *P < 0.05; **P < 0.01; ***P < 0.001.
