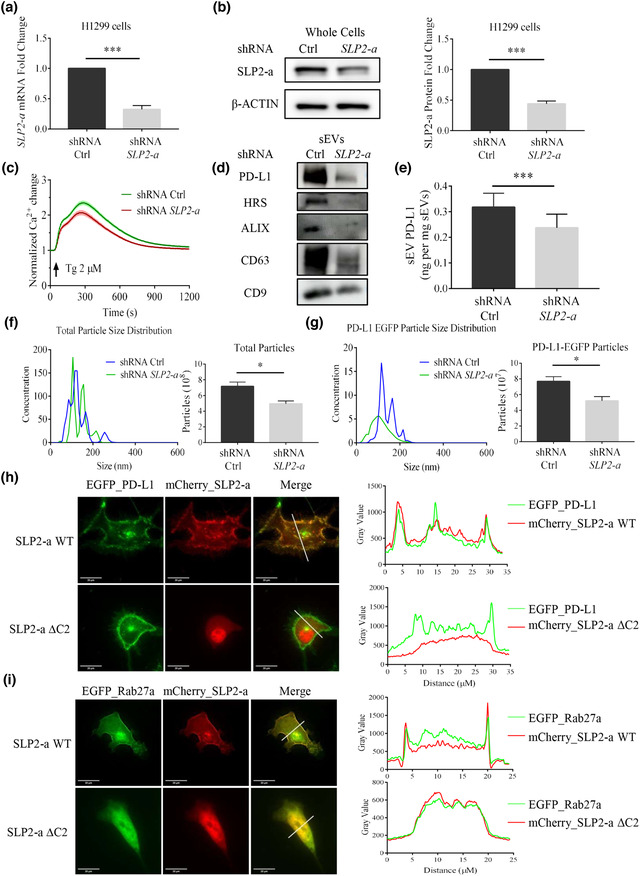
FIGURE 7.

SLP2‐a KD reduces sEV PD‐L1 secretion in H1299 cells. (a) shRNA efficiently reduces SLP2‐a mRNA levels in H1299 cells. (n = 3). (b) Immunoblotting analysis confirms SLP2‐a KD (left). Its quantification by western blots is shown in the right panel (n = 3). (c) SLP2‐a KD inhibits Tg‐ (2 μM) mediated Ca2+ dynamics in H1299 cells. Values of fluorescent intensity represent mean ± SEM, which is normalized to the basic fluorescence intensity. All data is derived from more than 4 wells in 3 individual experiments. (d) Immunoblotting analysis of sEVs protein in H1299 cells with or without SLP2‐a‐KD treatment. (e) Comparison by ELISA between amounts of PD‐L1 in sEVs derived from H1299 cells with or without SLP2‐a‐KD treatment. (n = 3). (f). Comparison of the total particle size distribution (left) and its quantification with or without SLP2‐a‐KD treatment in H1299 cells by NTA (n = 3). Units are in millions of particles per milliliter. (g) Comparison between PD‐L1 EGFP particle size distributions and quantification with or without SLP2‐a‐KD treatment in H1299 cells transfected with PD‐L1_EGFP by NTA (n = 3). Units are in millions of particles per milliliter. (h) Fluorescence images show the coexpression of PD‐L1_EGFP with mCherry_SLP2‐a (upper), or with mCherry_SLP2‐a ΔC2 (below). Quantitative fluorescent intensities along the white lines, as plotted in the original images. (i) Fluorescence imagines show the coexpression of EGFP_Rab27a with mCherry_SLP2‐a (upper), or with mCherry_SLP2‐a ΔC2 (below). Quantitative fluorescent intensities along the white lines, as plotted in the original images (right). For all of Figure 7, data are representative of at least three independent experiments.
