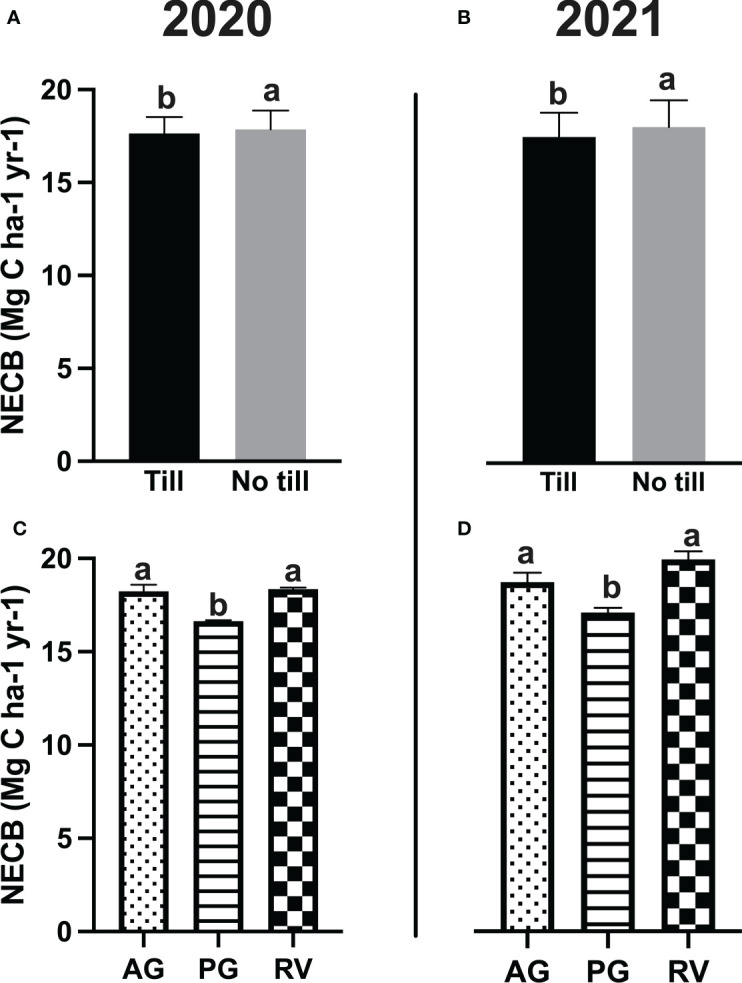
Figure 3.

(A, B) The net ecosystem carbon balance (NECB) as affected by tillage treatments in a Merlot vineyard in Oakville, CA, USA. (C, D) The NECB as affected by cover crop treatment in the same vineyard. Values represent means ± SE. Different letters indicate significant differences (p ≤ 0.05) between respective treatments according to two-way ANOVA followed by Tukey’s honest significant difference (HSD) test. AG, annual grass; PG, perennial grass; RV, resident vegetation.
