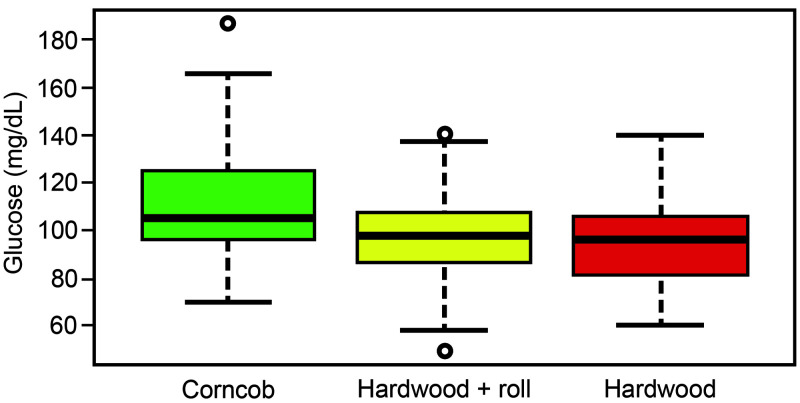
Figure 2.
Box plot distribution of FBG levels in mice exposed to 3 cage treatments, with median values and reference intervals. These box plots revealed differences in FBG data for corncob bedding, which were more dispersed and slightly different (P = 8.177 × 10⁻⁵) from those for the other 2 treatments.

