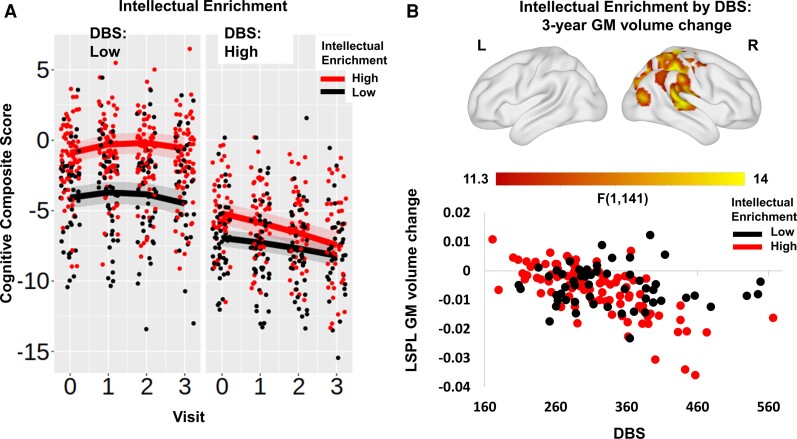
Figure 1.
Intellectual enrichment, cognitive function and brain volume. (A) Association between intellectual enrichment and DBS with global cognitive function [t(225.1) = −3.596, P < 0.001] and (B) T-map of 3-year GM volume change. In (A) regression lines are generated from a mixed linear model at high (1SD above mean; red) and low (1SD below mean; black) intellectual enrichment. For visualization purposes, results are split into high (above mean) and low (below mean) DBS. The bands around the regression lines are 95% confidence intervals. Data points show the raw data residualized against age, site, sex and use of antipsychotic medication and have been jittered to minimize overlap. In B, significant clusters are overlaid on the ICBM152 template mesh (top). Maps are thresholded at P < 0.001 uncorrected at voxel level and P < 0.05 family-wise error corrected at cluster level. Shown in a scatter plot (bottom) are the extracted values averaged across the significant cluster. For visualization purposes, data are grouped by high (above mean—red) and low (below mean—black) intellectual enrichment. Data points show the raw data residualized against age, DBS, site, sex and TIV. LSPL, left superior parietal lobe.

