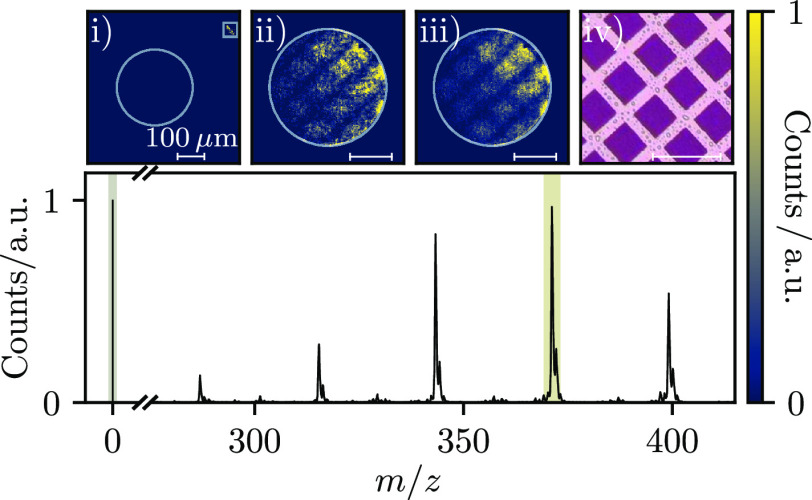
Figure 2.
Averaged mass spectrum of rhodamine B. Integrating the Timepix3 data over ToA (shaded regions) and centroiding the pixel clusters produces images of the photon (i) and m/z signals (ii = 371.2 Da). The integrated image corresponding to all rhodamine B fragments (iii) is also shown, along with an optical microscope image of the sample (iv). The white circles in images (i–iii) represent the scintillator boundary. The white box in (i) corresponds to the area used to retrieve the trigger marker and assign the t0,n.

