Figure 4.
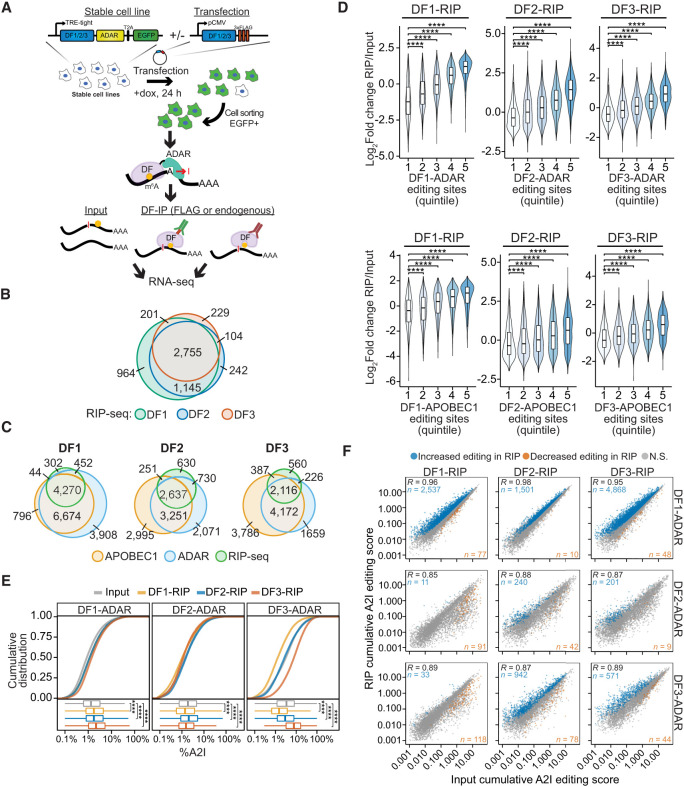
RIP-seq confirms cobinding of DF proteins to the same mRNA molecules. (A) Overview of the RIP-TRIBE experimental workflow. Stable HEK293T cell lines expressing DF-ADAR-HA-T2A-EGFP were transfected with FLAG-tagged DF proteins, and EGFP+ cells were sorted. DF proteins were then immunoprecipitated, and bound RNA was extracted and subjected to RNA-seq and A2I editing site analysis. RIP-TRIBE was performed using antibodies against either FLAG (to detect FLAG-DF protein targets) or DF proteins (to detect endogenous DF protein targets). (B) Overlap of DF target mRNAs identified by RIP-seq. (C) Overlap of the target mRNAs of each DF protein identified by RIP-seq and TRIBE-STAMP. DF-ADAR and DF-APOBEC1 targets are indicated. (D) Violin plots showing the relative enrichment of mRNAs in RIP-seq data sets (RIP/input). mRNAs are divided into quintiles based on the number of editing sites they contain in cells expressing the indicated DF-ADAR or DF-APOBEC1 proteins. Indicated P-values are the result of a Wilcoxon rank-sum test adjusted for multiple comparisons. (****) P < 1 × 10⁻⁵. (E) Cumulative distribution plots (top) and box plots (bottom) showing the average A2I editing rates in mRNAs from the input and RIP fractions for each DF-RIP sample. The DF-ADAR cell line in which each RIP was performed is indicated at the top. Significance was determined using a Kruskal–Wallis test followed by a post-hoc Dunn's test adjusted for multiple comparisons. (****) P < 1 × 10⁻⁵. (F) Scatter plot showing the cumulative RNA editing scores in input and RIP samples for each DF protein. The DF protein subjected to RIP is indicated at the top, and the DF-ADAR cell line in which RIP was performed is indicated at the right. For each comparison, the mRNAs with a statistically significant increase or decrease in editing levels are colored in blue and orange, respectively. Statistical significance was determined using a Wald's test with FDR < 0.05. The Pearson correlation coefficient is indicated in the top left corner. The numbers of mRNAs with increased or decreased editing are indicated in the top left and bottom right corners, respectively.

