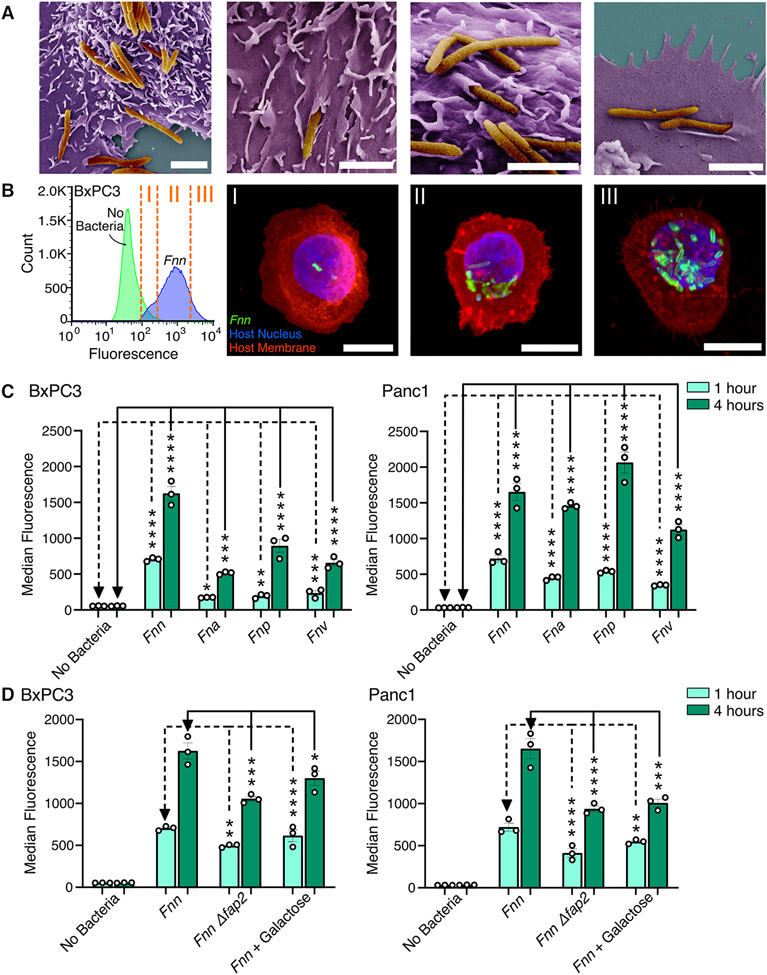
Figure 1. Fusobacterium nucleatum binds to and invades pancreatic cell lines.
(A) Scanning electron microscopy images of F. nucleatum subsp. nucleatum 23726 (Fnn) invading BxPC3 pancreatic cancer cells. Pseudocolored with orange for bacteria and purple for host cells. Scale bar: 2μm. (B) Flow cytometry analysis of BxPC3 cells cultured without bacteria or with Fnn at 50:1 MOI. Cells sorted based on fluorescence intensity correspond to intracellular bacterial loads (I: low, II: medium, III: high). These cells were plated and imaged on a confocal microscope to identify relative levels of infection. Host cell nuclei were stained with DAPI (blue), Fnn membranes were stained with FM 1-43 FX (green), and host cell membranes were stained with MemBrite 568 (red). Scale bar: 10 μm. (C) Flow cytometry analysis of infection of BxCP3 and Panc1 cells cultured with Fnn, Fna, Fnp, and Fnv at 50:1 MOI after 1 and 4 hours. (D) Flow cytometry analysis of infection of BxpC3 and Panc1 cells cultured with Fnn, Fnn Δfap2, or Fnn in the presence of Fap2-binding inhibitor galactose, at 50:1 MOI for 1 and 4 hours. Data in (B to D) are means ± SEM from N = 3 independent experiments per condition; comparisons by ordinary one-way ANOVA followed by Dunnett’s multiple comparisons test (C) or Šídák's multiple comparisons test (D): * P≤0.05, ** P≤0.01, *** P≤0.001, and **** P≤0.0001; ns, not significant.

