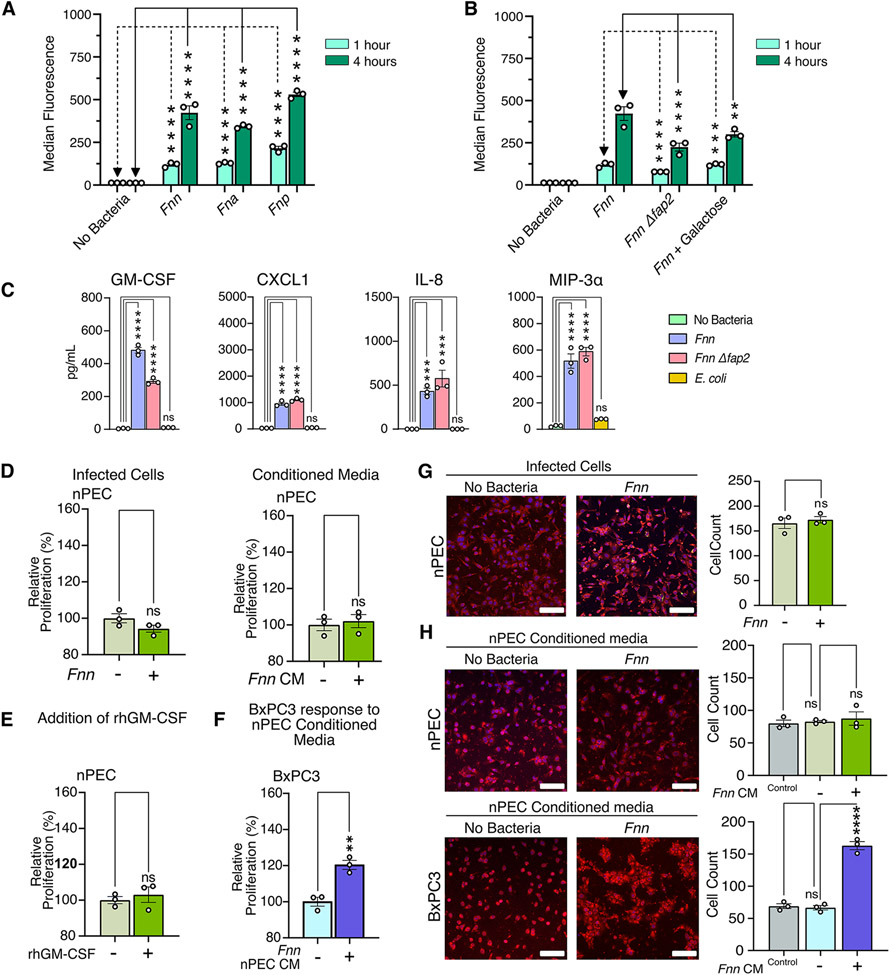
Figure 5: Normal pancreatic cells secrete cytokines upon Fusobacterium infection.
(A) Flow cytometry analysis of nPEC infection with Fnn, Fna, and Fnp and Fnn Δfap2 at 1 and 4 hours to assess bacterial invasion. (B) Flow cytometry analysis of nPEC infection with Fnn, Fnn Δfap2, and Fnn + Fap2-binding inhibitor galactose at 1 and 4 hours to assess bacterial invasion. (C) Secretion of GM-CSF, CXCL1, IL-8, and MIP-3α from nPECs upon infection with Fnn, Fnn Δfap2, or E. coli compared with each from uninfected nPECs, measured using ELISA. (D) XTT proliferation assays assessing proliferation of nPECs upon infection or culture in conditioned media from infected nPECs. (E) Proliferation of nPECs in response to rhGM-CSF, measured using the XTT assay. (F) Proliferation of BxPC3 cells cultured in conditioned media from infected nPECs, measured using the XTT assay. (G and H) Transwell migration assays to assess cell migration of infected nPECs (G) and of nPECs and BxPC3 cells cultured in conditioned, concentrated media from infected nPECs (H), stained with Cell Tracker Red. Scale bar: 100 μm. Data in (A to H) are means ± SEM from N = 3 independent experiments; comparisons by unpaired t-test (D, E, F, and G), and ordinary one-way ANOVA followed by Dunnett’s multiple comparisons test (A and C), Tukey’s multiple comparisons test (H), or Šídák's multiple comparisons test (B): * P≤0.05, ** P≤0.01, *** P≤0.001, and **** P≤0.0001; ns, not significant.

