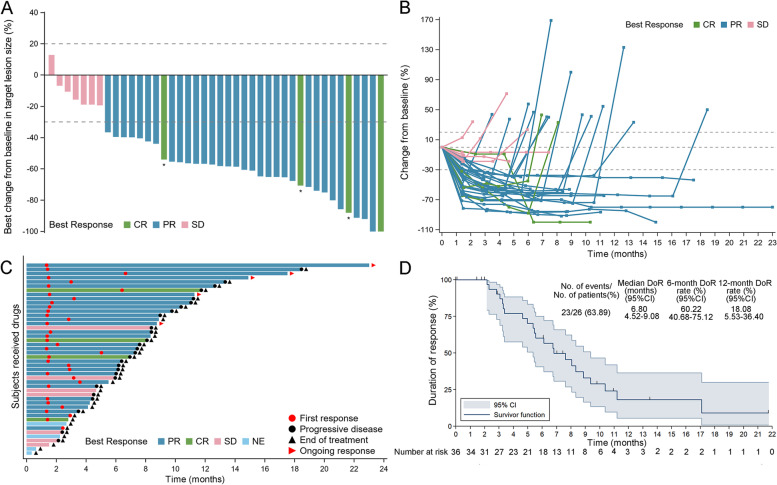
Fig. 4.
Tumor response. A Waterfall plot of tumor size change from baseline to maximum percentage in each patient as per RECIST version 1.1. B Longitudinal change in tumor size from baseline. C Time to response and duration of response. D Duration of response for patients with advanced ESCC. CR, complete response; PR, partial response; PD, progressive disease; SD, stable disease; NE, not evaluable; ESCC, esophageal squamous cell carcinoma. Asterisk symbol (*) indicates the following: CR was confirmed with the disappearance of all target lesions and any pathological lymph nodes (whether target or non-target) must have a reduction in short axis to < 10 mm

