Fig. 1.
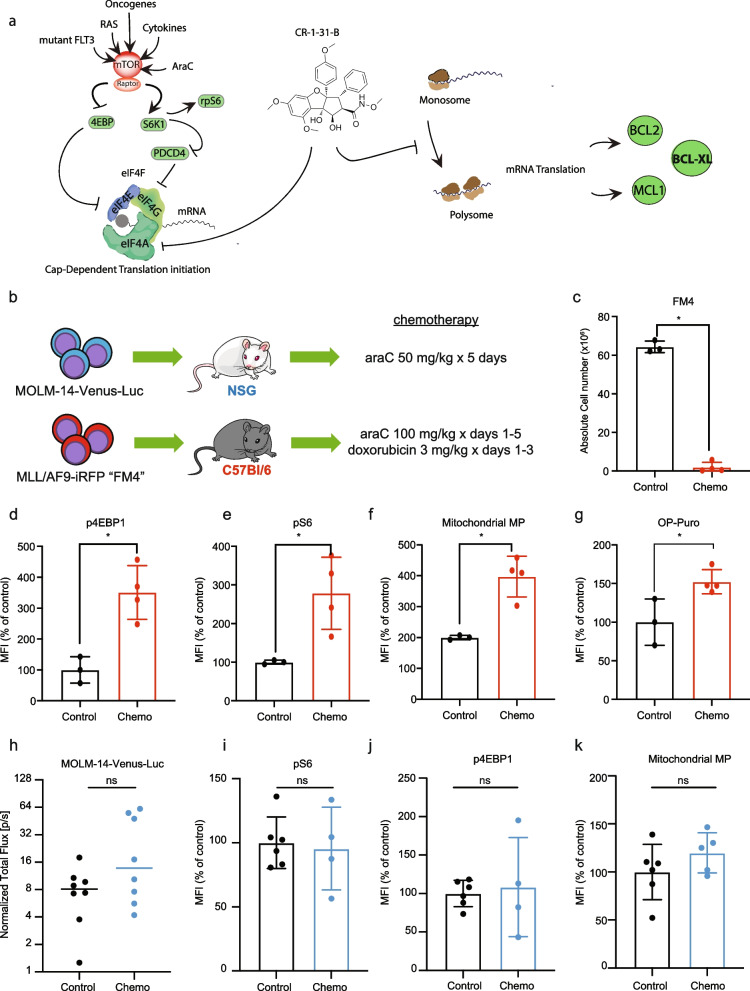
Chemoresistant AML cells show increased mTORC1 activity and mitochondrial function. a In AML, hyperactive mTORC1 signaling is driven by oncogenic signaling (i.e. mutated RAS, FLT3), chemotherapy and microenviromental cues such as cytokines [18–26]. mTORC1 is a multimeric complex containing the catalytic subunit mTOR serine/threonine kinase, and scaffolding unit Raptor. Two key mTORC1 substrates that regulate cap-dependent translation initiation are the eukaryotic initiation factor (eIF) 4E-binding proteins (4E-BPs) and the ribosomal protein S6 kinase 1 (S6K1). mTORC1 phosphorylation inhibits 4E-BPs, which are negative regulators of eIF4E. Active S6K1 phosphorylates rpS6 and the programmed cell death protein 4 (PCD4), a negative regulator of eIF4A. eIF4E cap-binding protein, eIF4G scaffolding protein and eIF4A RNA helicase are subunits of eIF4F, the rate-limiting complex in cap-dependent translation initiation. Activation of mTORC1 releases eIF4E and eIF4A from their negative regulators, 4EBPs and PDCD4, respectively, allowing the assembly of eIF4F. Proposed mechanisms for CR-1-31-B action include (i) direct inhibition of translation of the target mRNA by increasing eIF4A1:RNA binding (clamping) and (ii) depletion of the limited eIF4F pool available for ribosome recruitment leading to a trans-inhibitory effect toward mRNAs that are not directly affected by clamping [32, 33]. Among eIF4A targets are the BCL2 family members BCL-2, MCL-1 and BCL-XL [34]. b NSG or C57BL/6 J mice were transplanted with MOLM-14-Luc cells or FM4 cells, respectively. NSG mice were treated with 50 mg/kg araC injected intraperitoneally (i.p.) daily for 5 days. C57BL/6 J mice were treated with 100 mg/kg araC i.p. daily for 5 days with 3 mg/kg doxorubicin i.p. daily concomitantly from days 1-3. Analyses shown in c-k were performed at day 8 post treatment initiation. c Mean and SEM of total FM4 cells (y-axis) in bone marrow of C57BL/6 J mice treated with vehicle (Control, n = 3) or chemotherapy (n = 4). Significant differences were assessed by two-tailed unpaired t-test, *p < 0.05. d-g Chemoresistant FM4 AML cells were analyzed by flow cytometry to assess for differences on d p4E-BP, e pS6, f mitochondrial membrane potential (Mitochondrial MP) using TMRE and g OP-Puro incorporation. The y-axis represents the median fluorescence intensity and the bars, the mean values and SEM. Significant differences were assessed by two tailed unpaired t-test, *p < 0.05. h AML growth in NSG mice was assessed by in vivo bioluminescence imaging at days 1 and 8. Tumor burden on day 8 was normalized to tumor burden on day 1 (y-axis). The bar represents the mean value, ns indicates p > 0.05. i-k Chemoresistant MOLM-14 were analyzed by flow cytometry to assess for differences on i p4E-BP, j pS6, k Mitochondrial MP using TMRE. The y-axis represents the median fluorescence intensity and the bars, the mean values and SEM. Significant differences were assessed by two-tailed unpaired t-test; ns p > 0.05; MFI: mean fluorescence intensity. Data related to Fig. 1 are shown in Supp. Fig. 1

