
FIG. 3.
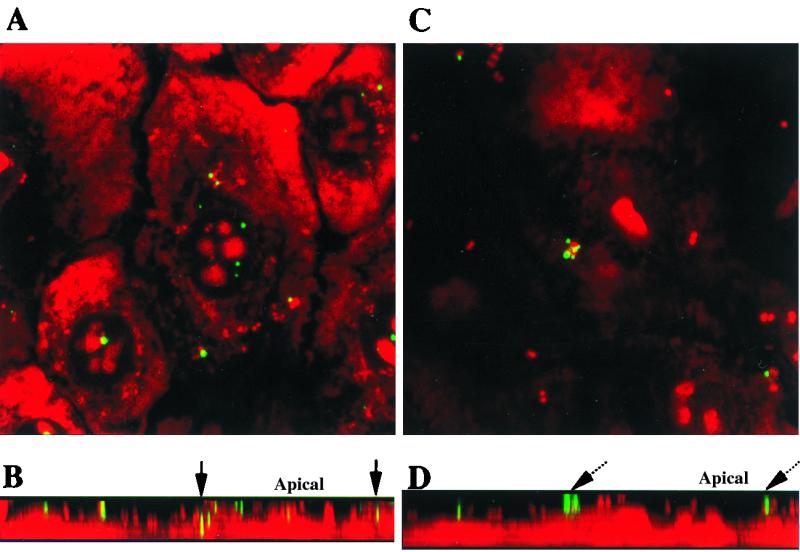
CLSM images of HUEC at 1 h postchallenge with N. gonorrhoeae and FITC-labeled dextran-70,000. Stacked images in the x/y axis (A) and in the z axis (B) show infection in the absence of any inhibitors. Dextrans fluorescing green are observed in continuity with organisms fluorescing red, resulting in yellow fluorescence at sites of colocalization in intracellular vesicles (solid arrow). Panels C and D show HUEC that were incubated with 1 μM wortmannin for 2 h prior to challenge. Stacked images in the x/y axis (C) and in the z axis (D) reveal dextrans and organisms localized to the cell surface with no dextran internalization (dashed arrow). Magnification, ×60.