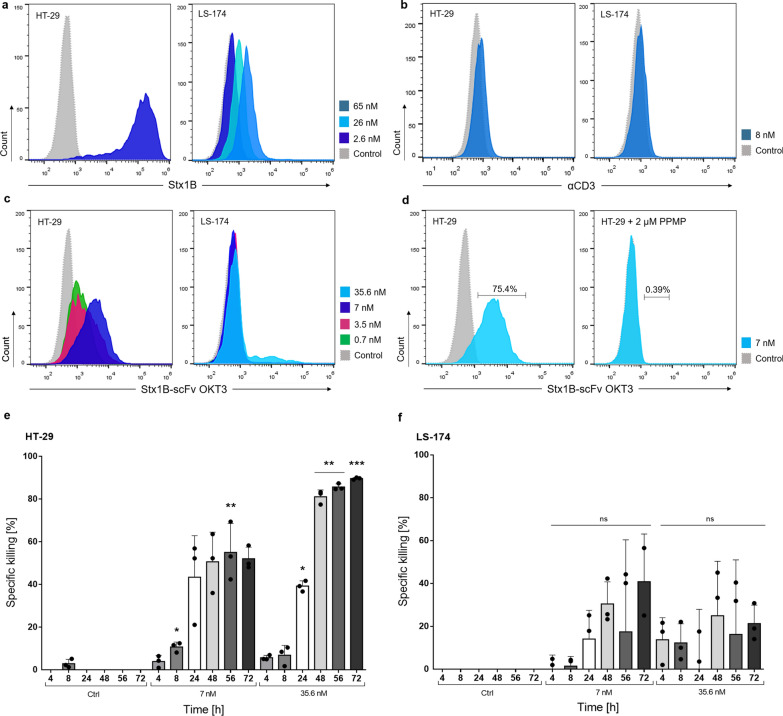
Fig. 8.
Recognition of solid tumor cells by Stx1B-scFv OKT3 and redirected in vitro tumor cell lysis. a Representative histograms of flow cytometry analysis of gated living HT-29 and LS-174 cells treated with 2.6, 26 or 65 nM Stx1B for the assessment of Gb3 abundance at the plasma membrane. HT-29 cells showed a high presence of Gb3, while LS-174 exhibited low amount of Gb3 at the cell surface. b Histograms of flow cytometry analysis of HT-29 and LS-174 cells incubated with 8 nM anti-human CD3 Alexa-Fluor® 647 antibody (αCD3) confirming the absence of CD3 on tested cells. c Flow cytometry analysis of HT-29 and LS-174 treated with increasing lectibody concentrations (dotted, grey: negative control; green: 0.7 nM; magenta: 3.5 nM; blue: 7 nM, light blue: 35.6 nM), showing a dose-dependent trend in protein binding. c Flow cytometry analysis of HT-29 cells treated with Stx1B-scFv OKT3 without (left plot) or after (right plot) Gb3 depletion upon PPMP-treatment. When Gb3 synthesis was inhibited, binding of the lectibody to target cells decreased remarkably. The number of cells within the live population (y-axis) is plotted against the fluorescence intensity of a Stx1B, b αCD3, c, d Stx1B-scFv OKT3 (x-axis). e Quantification of specific cancer cell killing upon incubation of PBMCs and HT-29 cells or f PBMCs and LS-174 cells in presence of 7 nM or 35.6 nM lectibody for 72 h. Results are expressed as a mean ± SD (n = 3). The experiments were performed with PBMCs derived from 3 different donors. Each dot represents data from individual donors. Data of cell proliferation are not shown in the graph. Statistical differences in independent samples were determined with a two-tailed, unpaired t-test. Tests with a p-value ≤ 0.05 are marked with an asterisk (*). p-values ≤ 0.01 are shown as two asterisks (**), and ≤ 0.001 are summarized with three asterisks (***)

