Fig. 4.
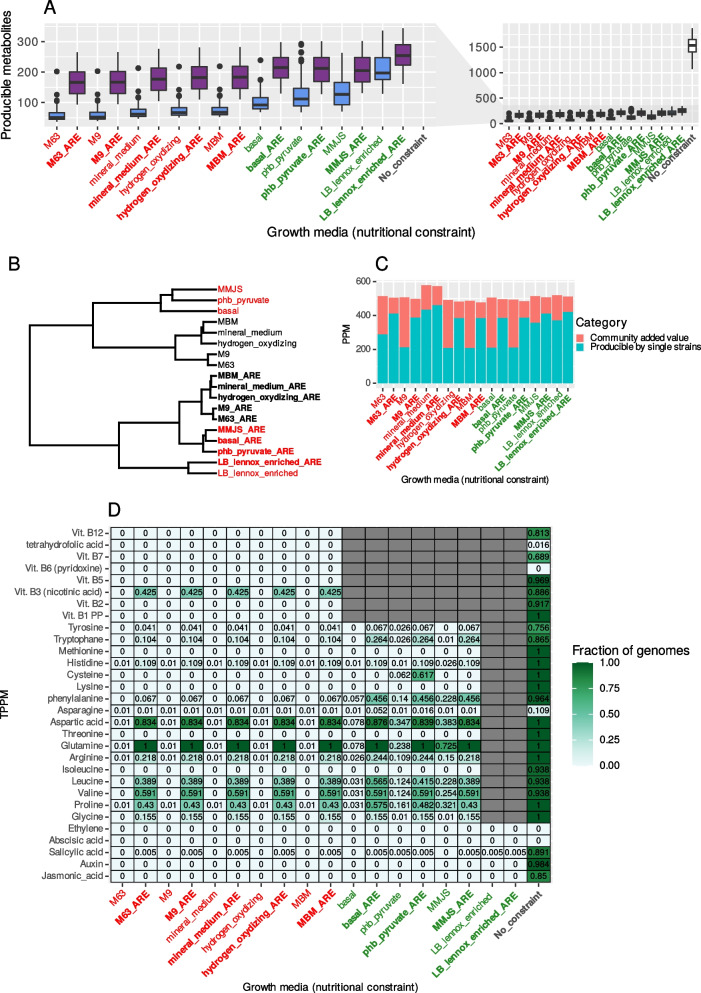
Effect of nutritional constraints on PPM and TPPM. A Boxplots of the number of PPM per GEM according to the growth medium, compared to no constraints. B Hierarchical clustering (“complete” method, Bray-Curtis distances) of growth media according to the composition of the PPM of the whole community (without community-added value). C Number of PPM of the complete community according to the growth media, with the value added by metabolic cross-feeding. D TPPM production per growth medium. Decimal numbers indicate the fraction of GEMs capable of producing the compound. Gray cells correspond to growth media already containing the TPPM, which are thus irrelevant. On all axes of the figures, poor media are labeled in black, rich media in red, ARE-enriched media in bold, and standard media in plain text

