
Figure 4 – Molecular adaptations of TMT exposure in the anterior insular cortex and the nucleus accumbens.
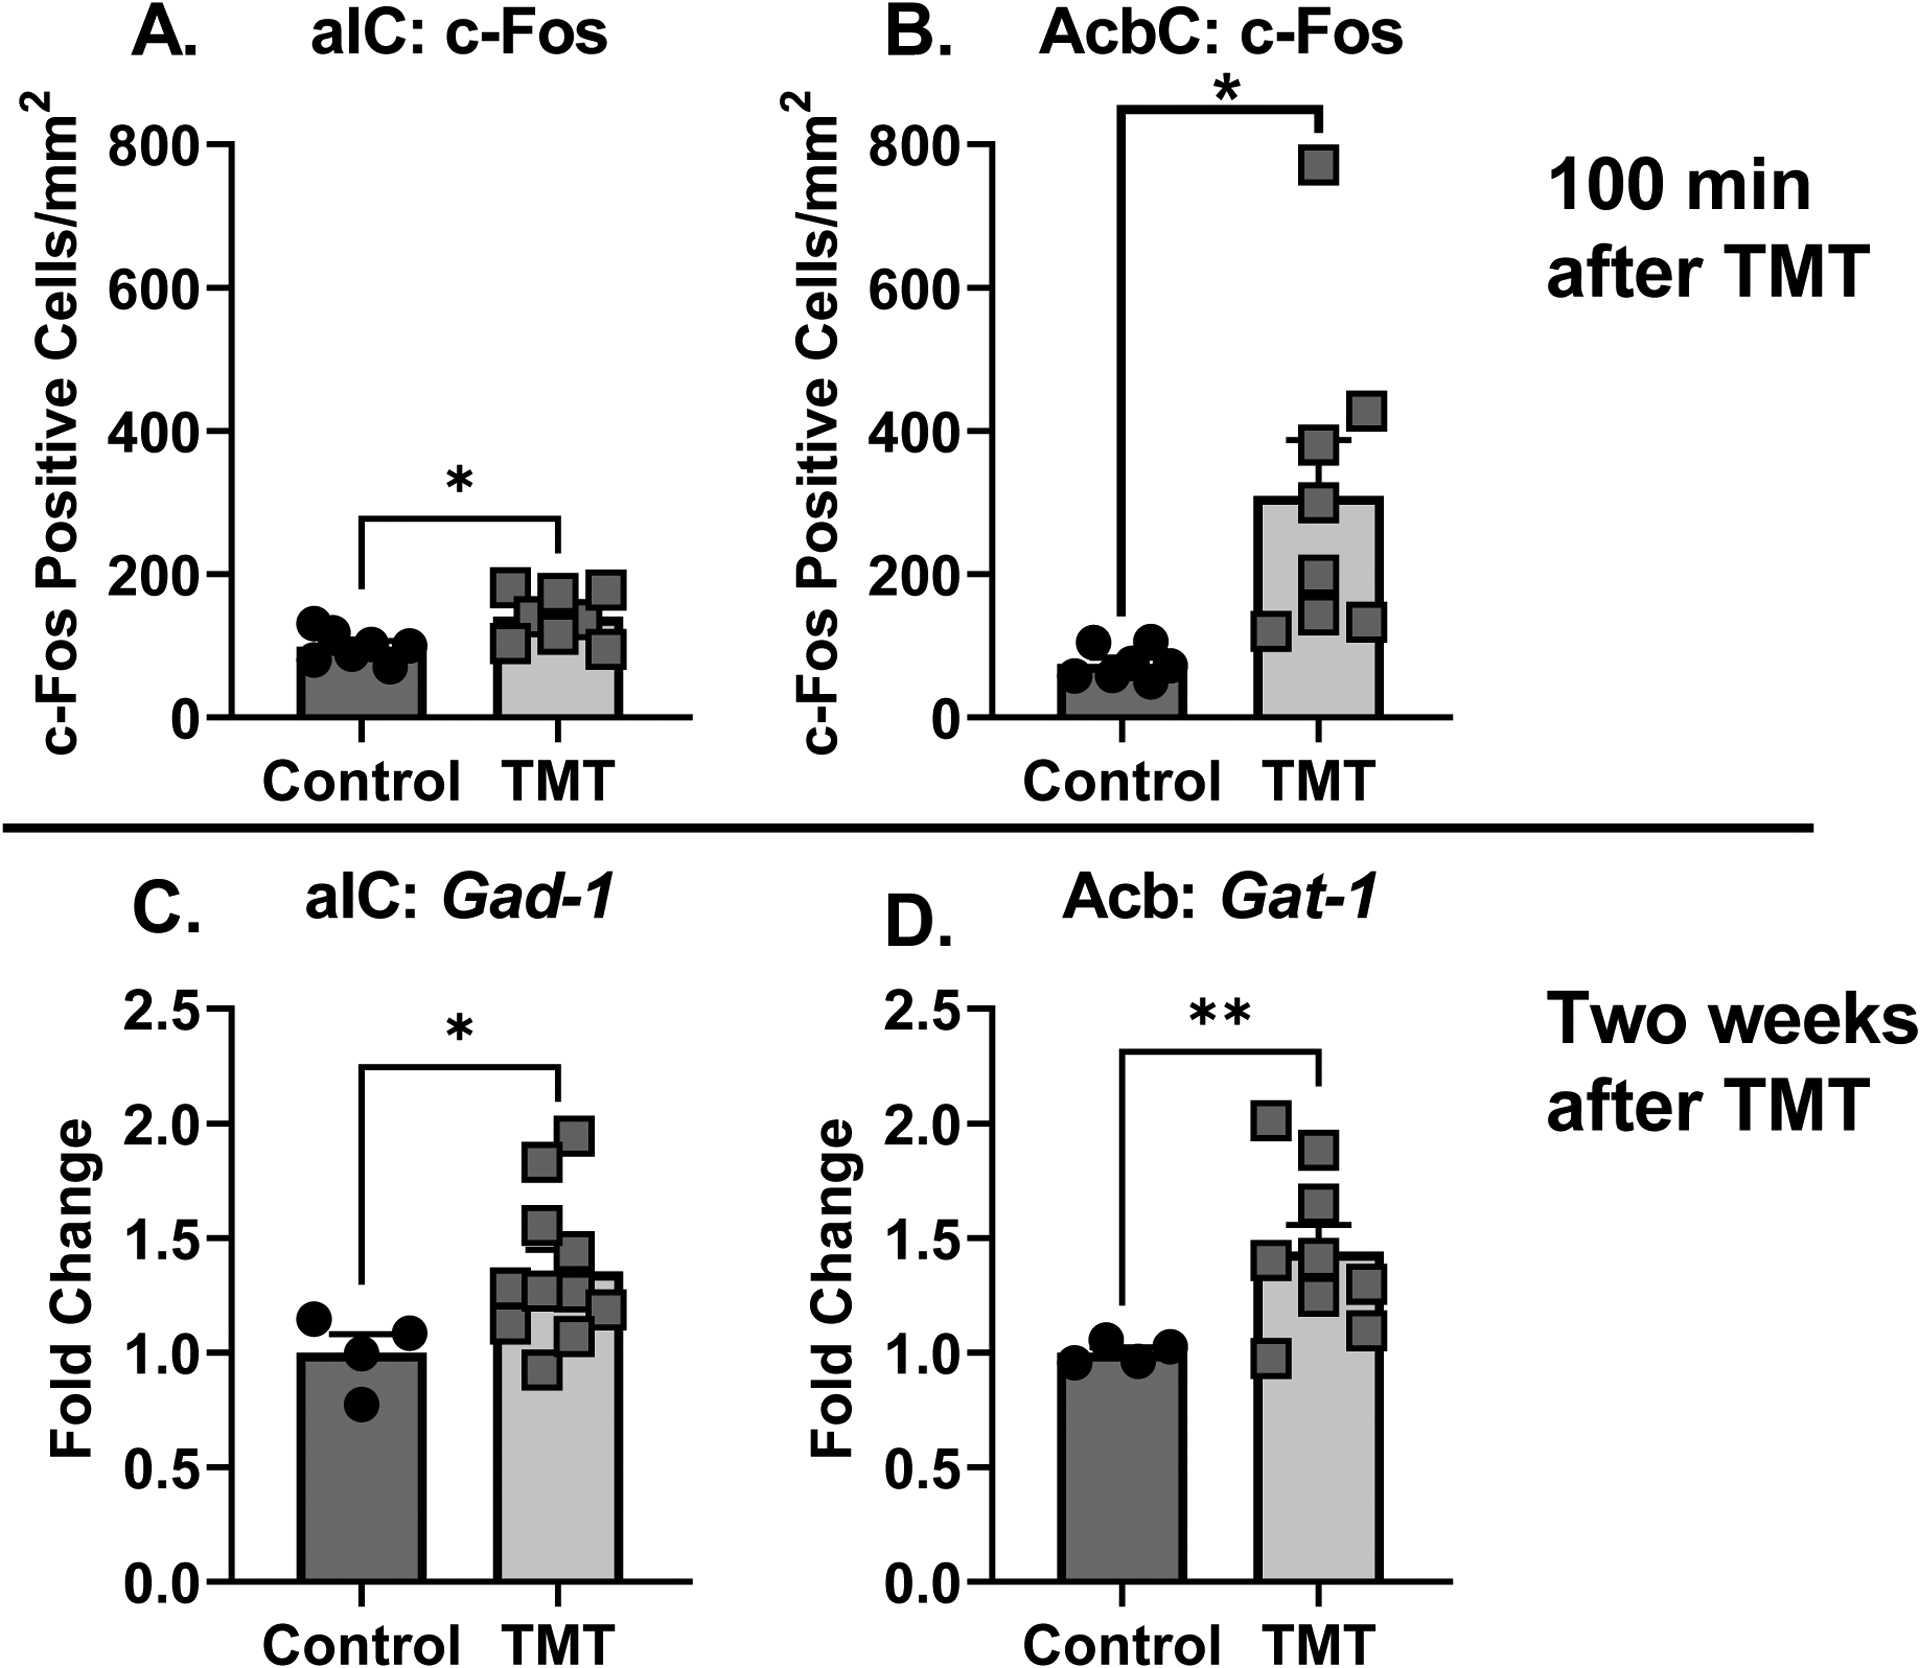
The TMT group showed increased c-Fos immunoreactivity compared to controls in the (A) aIC and (B) AcbC. The TMT group showed increased gene expression of Gad-1 in the (C) aIC and Gat-1 in the (D) Acb compared to controls. *p<0.05