
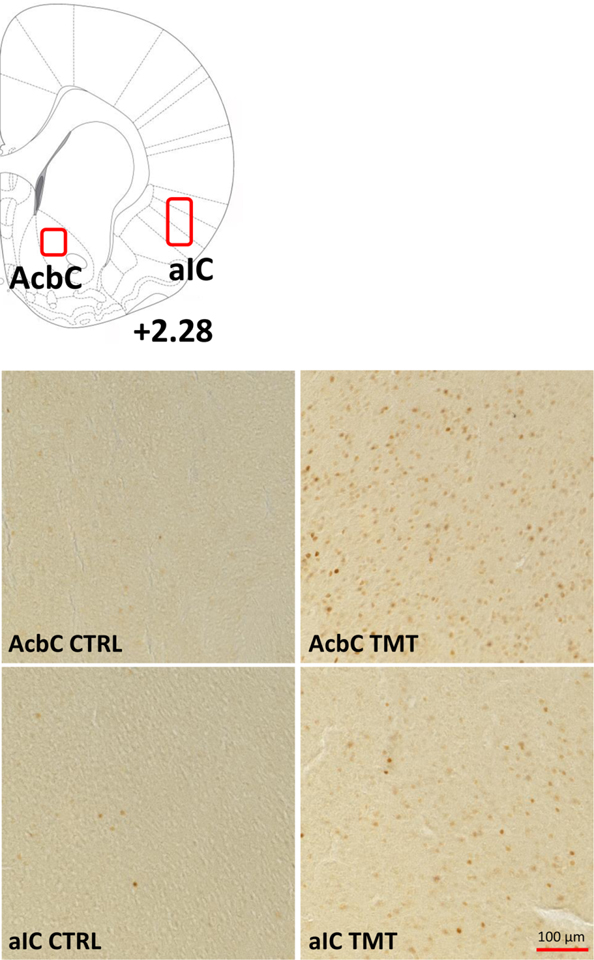
Table 1 – c-Fos Images (Experiment 2).
Table 1 shows the areas of quantification and representative images for the c-Fos experiment in the nucleus accumbens core (AcbC) and the anterior insular cortex (aIC) in Water (CTRL) and TMT-exposed rats.
|
Official websites use .gov
A
.gov website belongs to an official
government organization in the United States.
Secure .gov websites use HTTPS
A lock (
) or https:// means you've safely
connected to the .gov website. Share sensitive
information only on official, secure websites.
Table 1 shows the areas of quantification and representative images for the c-Fos experiment in the nucleus accumbens core (AcbC) and the anterior insular cortex (aIC) in Water (CTRL) and TMT-exposed rats.
|
|