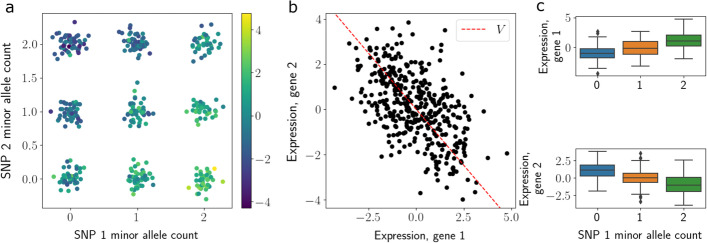
Fig. 2.
eQTL mapping in simulated single-cell data with PRRR. Toy example demonstrating eQTL mapping with PRRR for two genetic variants and two genes. a Genotype data, shown as the number of copies of the minor allele for variant 1 (x-axis) and variant 2 (y-axis) and colored by each sample’s corresponding expression of gene 1. b Gene expression values. The red line represents the fitted value for with in this toy example for gene 1 (x-axis) and gene 2 (y-axis). c Relationship between genotype (x-axis) and gene expression (y-axis) for the two genes

