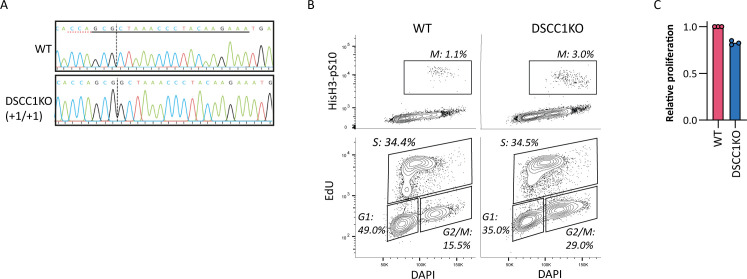
Figure S1. Characteristics of DSCC1-KO cells.
(A) Alignment of sequences of WT and DSCC1-KO cells at the crDSCC1 target site. The red dotted line indicates the PAM site, and the black dotted line indicates the Cas9 cut site. (B) Cell cycle analysis of WT and DSCC1-KO cells using flow cytometry. Mitotic cells (M) are identified by phosphorylation of histone H3 at serine 10. Actively replicating cells (S) are identified by EdU incorporation, and G1 and G2 are separated by DNA content as stained by DAPI. (C) Proliferation of DSCC1-KO cells relative to WT cells was assessed by CTB assay after 5 d of proliferation. Dots indicate the mean calculated from three technical replicates from three independent experiments.

