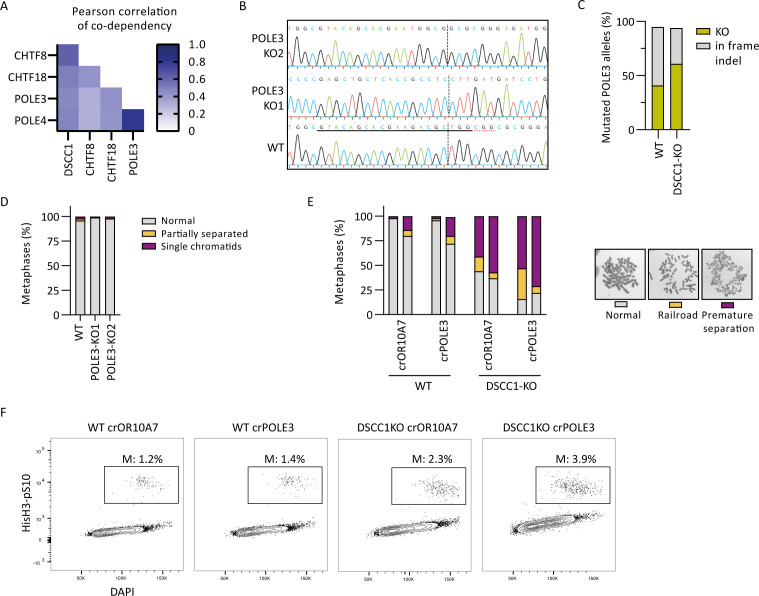
Figure S2. Genetic relationship between POLE3 and DSCC1.
(A) Pearson correlation of co-dependency score between cell lines of the top four genes correlating with DSCC1 extracted from depmap.org. (B) Alignment of sequences of WT, POLE3-KO1, and POLE3-KO2 cells at the crPOLE3 target site. The red dotted line indicates the PAM site, and the black dotted line indicates the Cas9 cut site. Note that alignment at the crPOLE3 site for POLE3-KO1 is completely lost because of a 125 bp deletion. (C) CRISPR editing efficiency at the crPOLE3 target site resulting in KO indels (out of frame or >26 bp deletion) or in frame indels. (D) SCC defects of indicated cell lines. At least 50 metaphases were scored per condition. (E) SCC defects of indicated cell lines, after transfection with indicated crRNAs. At least 50 metaphases were scored per condition, and two independent experiments are shown as separate bars. (F) Percentage of mitotic cells assessed by FACS analysis of histone H3 phosphorylated at serine 10.

