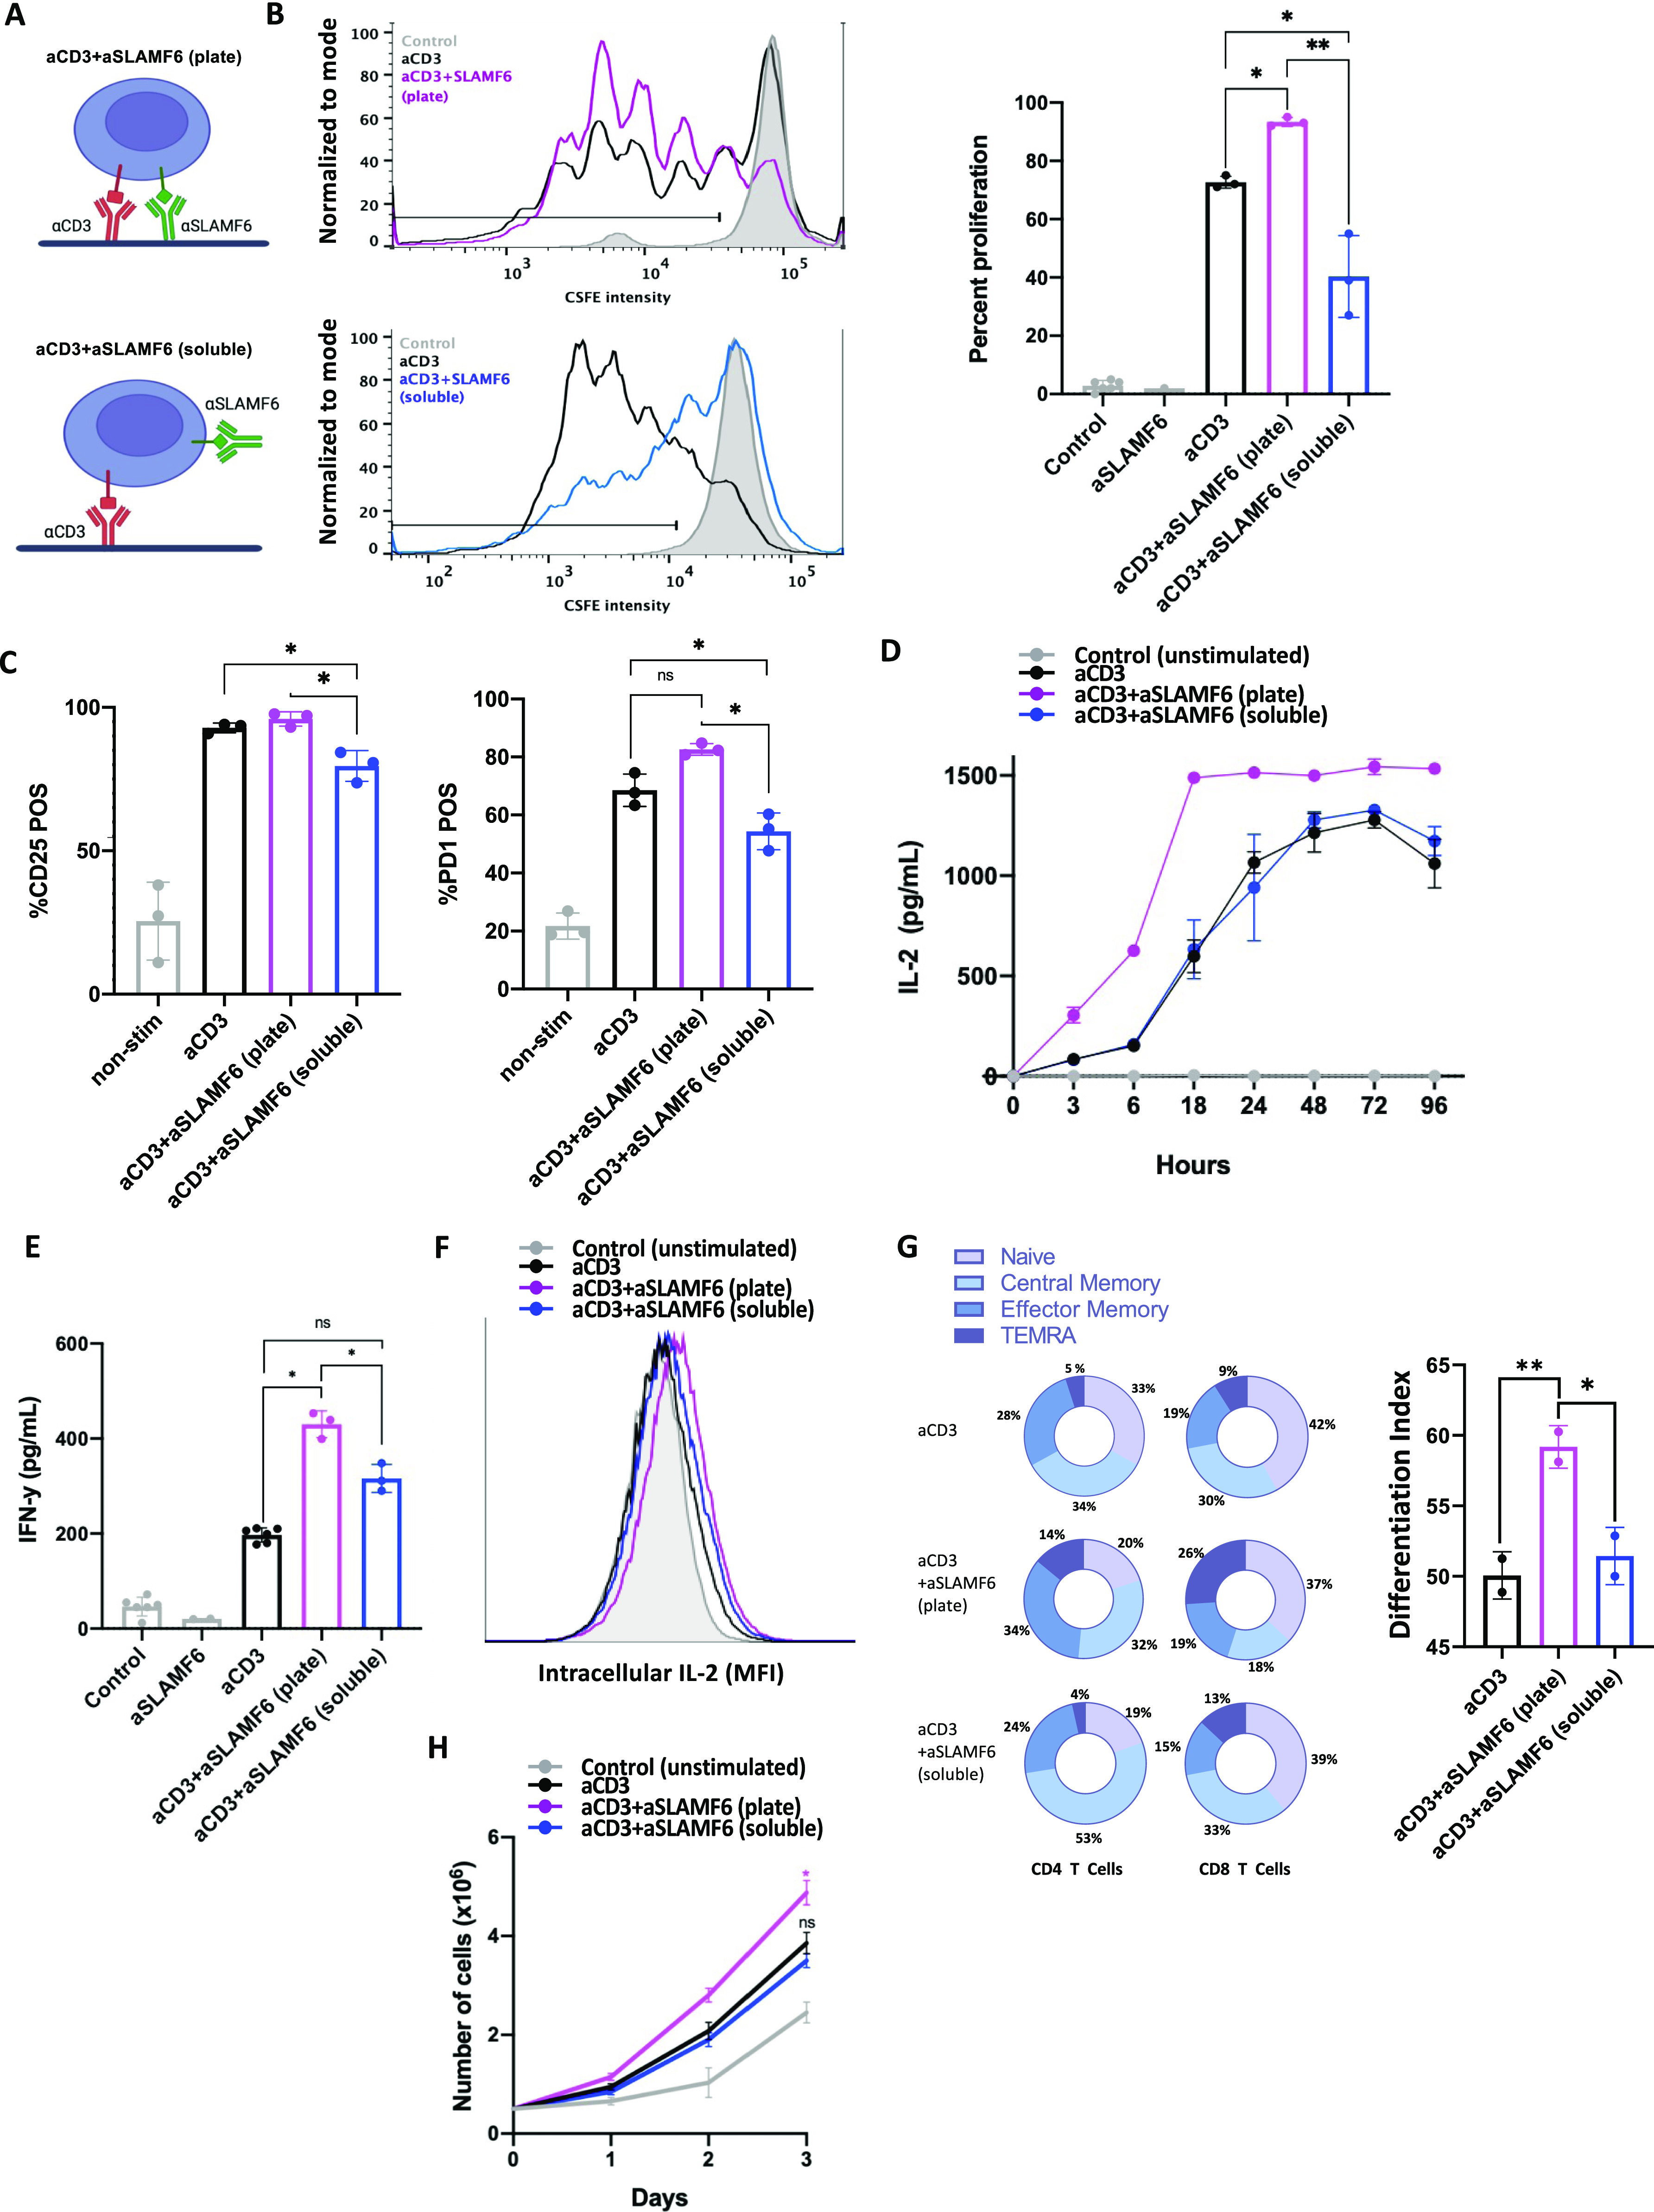
Figure 1. Separation of SLAMF6 and CD3 inhibits T cell proliferation.

(A) A schematic representation of the assays used to study SLAMF6 compartmentation. T cells were stimulated with either immobilized anti-CD3 (αCD3) and anti-SLAMF6 (αSLAMF6) on a plate surface (top) or immobilized αCD3 but soluble αSLAMF6 (bottom). (B) Freshly isolated primary CD3+ T cells were stained with CFSE then cultured in the presence of plate-coated αCD3 or plate-coated αCD3 + αSLAMF6 or plate-coated αCD3 + soluble αSLAMF6. After 120 h, the cells were assayed for FITC fluorescence for three independent experiments (n = 3). The data were analyzed for percent (%) of proliferating cells as depicted (black line); plate-coated αCD3 + αSLAMF6 resulted in greater proliferation as compared with αCD3 alone, whereas addition of soluble αSLAMF6 inhibited proliferation. (C) CD25 and PD-1 expression at 120 h was analyzed using flow cytometry. (D, E) Freshly isolated primary CD3 T cells were cultured in the presence of plate-coated αCD3 + αSLAMF6 or plate-coated αCD3 + soluble αSLAMF6. (D, E) The supernatant was harvested and IL-2 levels at different time intervals over 96 h and (E) IFN-y levels at 48 h were analyzed by ELISA. (F) Jurkat T cells were stimulated in the presence of brefeldin for 6 h, after which time intracellular IL-2 was analyzed by flow cytometry. This experiment was repeated twice (n = 2). (G) Freshly isolated primary CD3 T cells were cultured as above for 120 h. Cell differentiation was analyzed based on cell surface expression of CD45RA and CCR7. A weighed T cell maturation index was calculated as (1*Naïve + 2*Central Memory + 3*Effector Memory + 4*Terminal Effector Memory)/4. This experiment was repeated twice with the average value shown here. (H) Cell number was assessed by automated cell counting every 24 h. The experiment was done in triplicate (n = 3). *P ≤ 0.05 for an unpaired t test.
