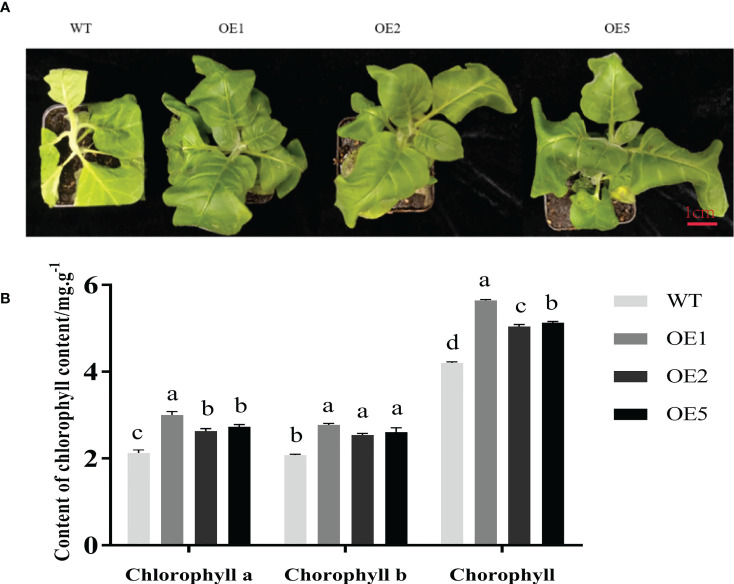
Figure 3.
Growth and chlorophyll content of tobacco under salt stress. (A) The phenotype of tobacco after 10 days of salt stress. (B) Chlorophyll content of tobacco after 10 days of salt stress. Error bars on each column indicate SDs (n=3). The letters above the bars indicate the significant difference of different lines at P<0.05.

