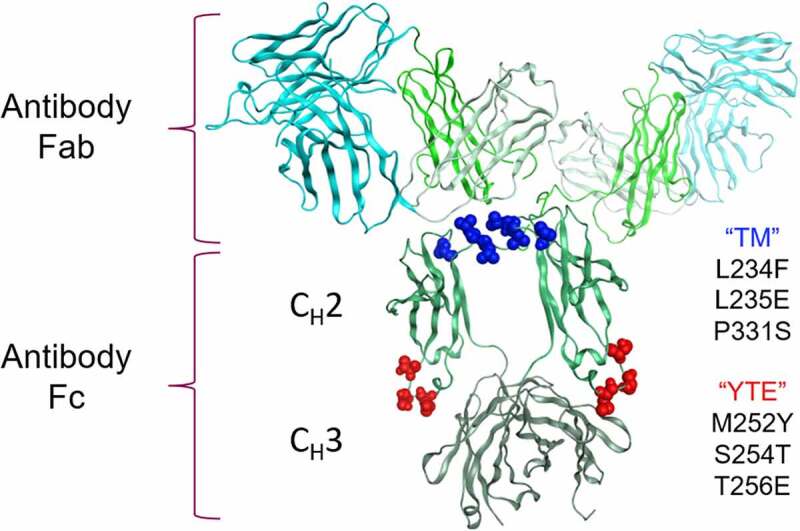
Figure 1.

Clustering of the TM-YTE modifications on the IgG1 structure. The TM (L234F/L235E/P331S, shown in dark blue spheres) and YTE (M252Y/S254T/T256E, shown in red spheres) Fc modifications were mapped onto the IgG1 structure (PDB ID 1HZH). The antibody Fab and Fc regions are marked as well as the Fc CH2 and CH3 domains. The antibody Fv is shown in cyan, and the constant domains are shown in different shades of green. Note that while both the TM and YTE modifications are in CH2, the TM modification cluster at the top of the CH2 domain near the hinge region in the binding regions for FcγRs and C1q while the YTE modification cluster near the CH3 domain in the binding region for FcRn. Ribbon diagram of an IgG1 crystal structure with the location of TM and YTE modification sites highlighted as spheres. Both modifications cluster in the Fc CH2 domain.
