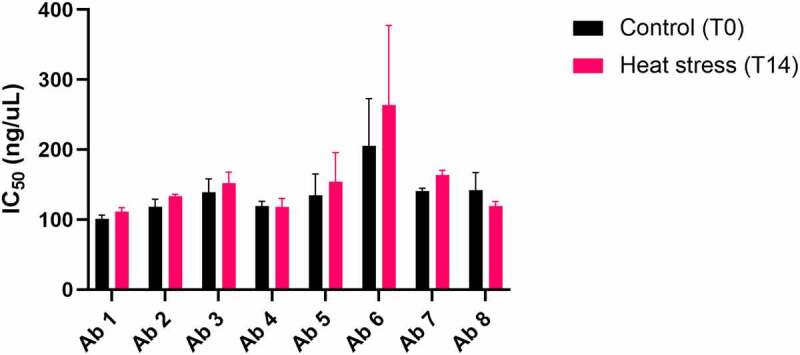
Figure 3.

Antibody RBD binding relative potency after 14-day accelerated stability heat stress. Antibody binding to SARS-COV-2 RBD protein before (T0) and after (T14) heat stress at 45°C was compared using a DELFIA. Binding curves were generated for each antibody and used to calculate IC50 values for T0 and T14, which are shown. The average T0 and T14 IC50 values (ng/mL) from both experiments, respectively, are as follows: antibody 1 = (101.1, 111,5); antibody 2 = (118.6, 133.5); antibody 3 = (139.3, 152.3); antibody 4 = (119.4, 118.2); antibody 5 = (134.7, 154.2); antibody 6 = (205.6,263.7); antibody 7 = (140.8, 163.8); antibody 8 = (142.4,119.5). The experiment was run twice. Bars represent standard deviations. T0 and T14 values from both experiments were averaged and compared using a Student’s t-test. None of the antibodies showed a significant difference between T0 and T14. A bar graph plotting the binding potencies of Ab 1–8 before and after heat stress for 14 days. No significant change in potency is observed after heat stress.
