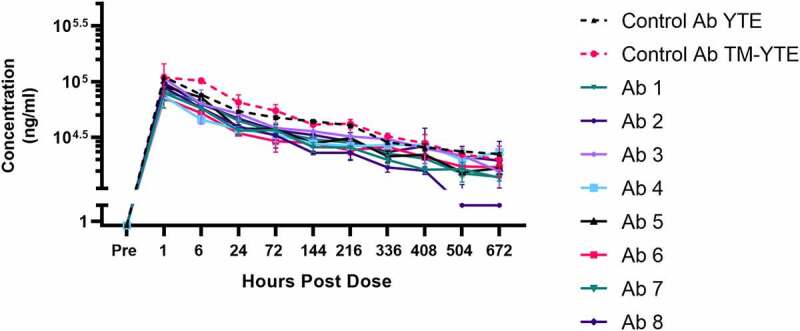
Figure 6.

Serum concentration curves of the TM-YTE antibodies in human FcRn transgenic mice. Mean concentrations of the TM-YTE antibody panel and a well characterized control antibody in human FcRn transgenic Tg32 mouse serum following a single IV injection of 5 mg/kg are shown. Bars represent standard deviations. Pharmacokinetic parameters can be found in supplementary Table 1. A line graph plotting the mean serum concentration vs hours post dose following a single IV injection of 5 mg/kg antibody into human FcRn transgenic Tg32 mice. Test Ab1-8 are compared to control mAbs in YTE and TM-YTE formats. Beginning at 504 hr post dose, Ab 2 begins to show significantly reduced serum concentration compared to the controls and other test Abs.
