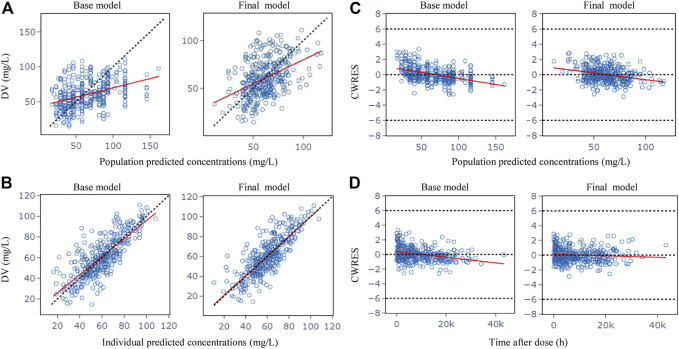
FIGURE 1.
Goodness-of-fit plots for the base model and the final model. (A) Observed (DV) vs. population predicted concentrations (PRED); (B) DV vs. individual predicted concentrations (IPRED); (C) Conditional weighted residuals (CWRES) vs. PRED; (D) CWRES vs. time after dose. The red lines in the panel represent linear fit lines.

