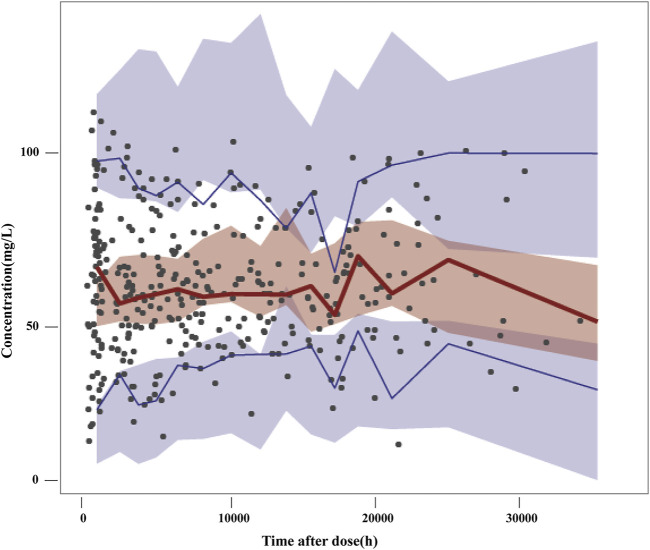
FIGURE 2.
Visual predictive checks of the final model. Black dots represent the observed concentrations; the red line represents the 50th percentile of the observations; the blue lines represent the 5th and 95th percentiles of the observations. The shaded areas represent the simulation-based 95% confidence interval for each line.

