
FIGURE 3.
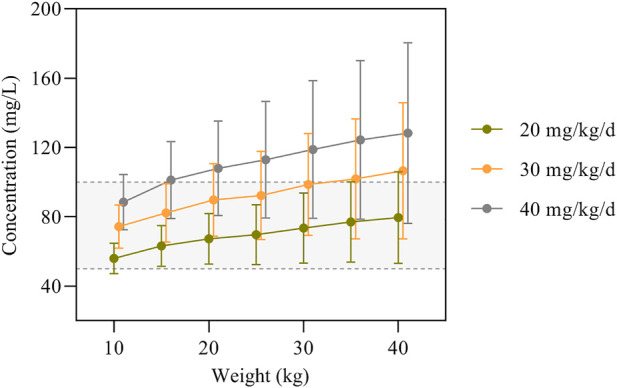
VPA trough concentrations predicted by the final model based on dose and body weight. The concentrations are shown as means with error bars representing standard deviations from the mean. The semitransparent grey field delimited by dashed lines represents the target therapeutic range (50–100 mg/L).