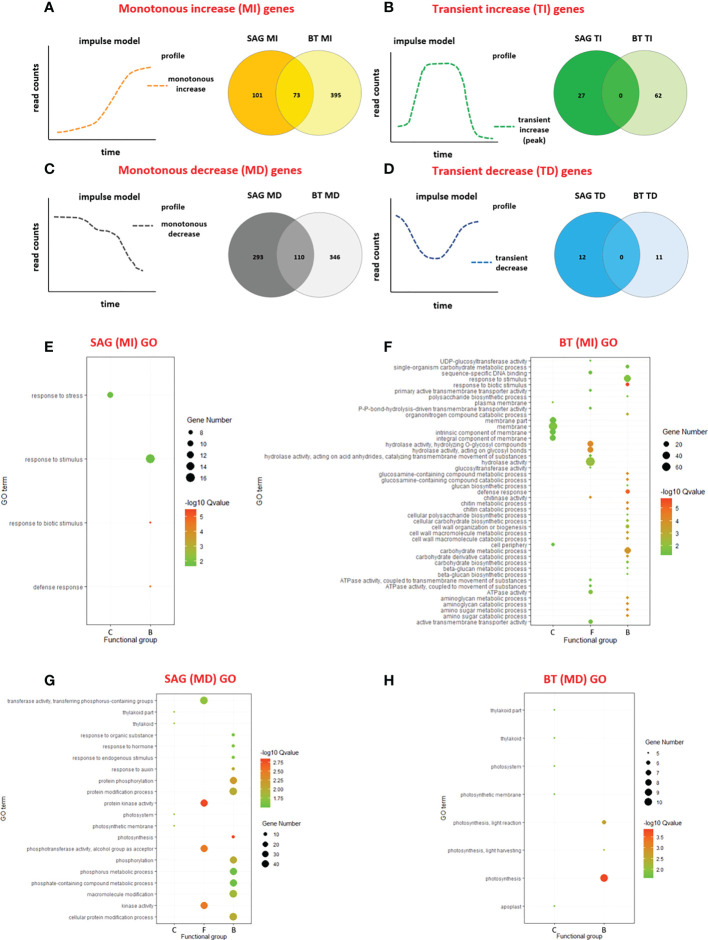
Figure 4.
Differential expression in the two cultivars. Venn diagrams of shared and unique genes related to temporal profiles in the two cultivars, in the four different clusters MONOTONOUS INCREASE (MI) (A), MONOTONOUS DECREASE (MD) (B), TRANSIENT INCREASE (TI) (C) and TRANSIENT DECREASE (TD) (D). GO enrichment analysis of MI and MD cluster genes in the two cultivars: MI genes in SAG (174) (E), and BT (468) (F); MD cluster genes in SAG (403) (G) and BT (456) (H), including C, cellular components; F, molecular functions and B, biological processes. The pathway enrichment analysis was performed with KOBASS, online tool, and the detailed information is presented as a bubble chart. The size of the bubbles represents the number of assigned genes, and the color of bubbles represents the -log10 (Q-value).

