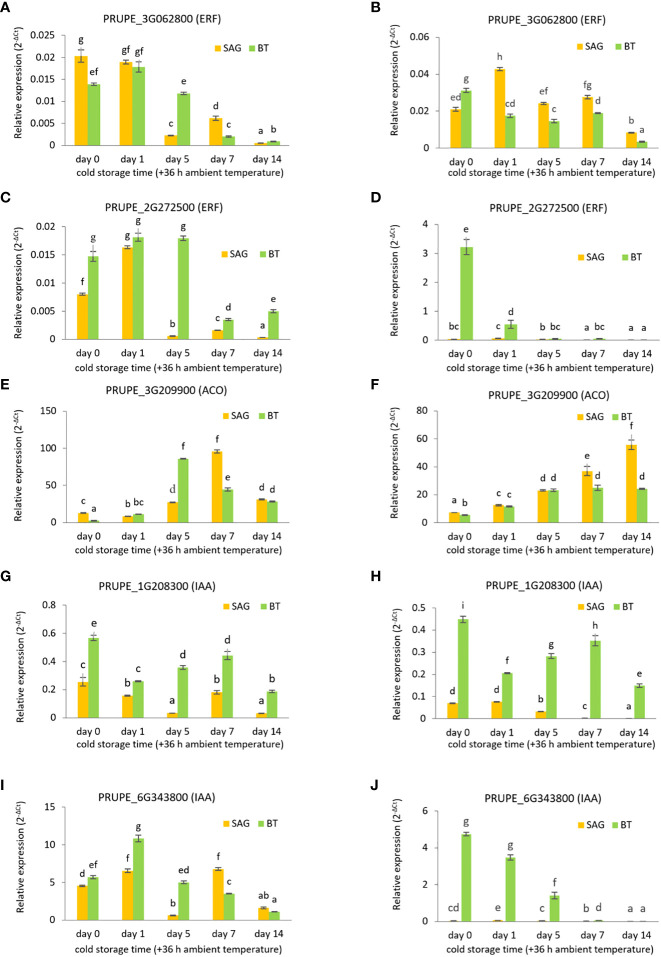
Figure 5.
Real-time PCR analysis of selected DEGs related to ethylene and auxin signalling in SAG peach and BT nectarine, during cold storage treatment (1°C) at day 0, 1, 5, 7 and 14 followed by 36 h recovery at ambient temperature (22 °C). in two seasons 2017 (A, C, E, G, I) and 2018 (B, D, F, H, J). PRUPE_3G062800 (ERF) (A, B); PRUPE_2G272500 (ERF) (C, D); PRUPE_3G209900 (ACO) (E, F); PRUPE_1G208300 (AUX/IAA) (G, H); PRUPE_6G343800 (AUX/IAA) (I, J). Different letters indicate significant differences among cultivars considering all time points and both years. Statistical analyses were performed using ANOVA and Tukey’s ranked test (P < 0.05). Data are the mean ± SE; n=3.

